
- Title
-
Fate mapping embryonic blood in zebrafish: multi- and unipotential lineages are segregated at gastrulation
- Authors
- Warga, R.M., Kane, D.A., and Ho, R.K.
- Source
- Full text @ Dev. Cell
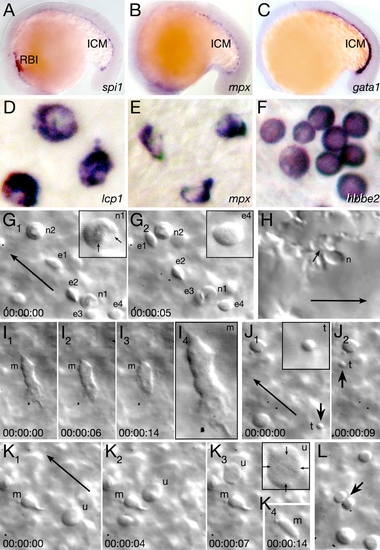
Characterization of Embryonic Blood EXPRESSION / LABELING:
|

Lineage Tracing and Fate Map Analysis of the Embryonic Blood |
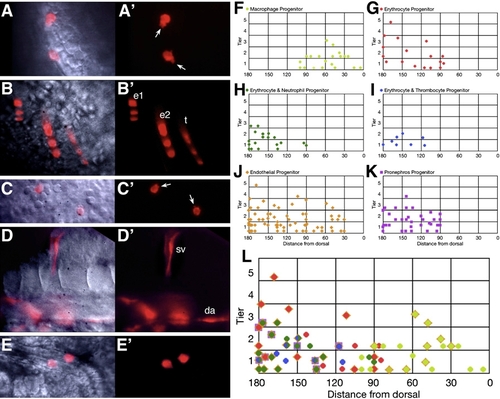
Hematopoietic Progenitors Originate from Both the Dorsal and Ventral Gastrula |

Not All Blood Is Committed to a Unipotential Lineage at 26 hr |

Blood Formation in the Cell Cycle-Arrested Mutant harpy |
Reprinted from Developmental Cell, 16(5), Warga, R.M., Kane, D.A., and Ho, R.K., Fate mapping embryonic blood in zebrafish: multi- and unipotential lineages are segregated at gastrulation, 744-755, Copyright (2009) with permission from Elsevier. Full text @ Dev. Cell