
- Title
-
7SK snRNP/P-TEFb couples transcription elongation with alternative splicing and is essential for vertebrate development
- Authors
- Barboric, M., Lenasi, T., Chen, H., Johansen, E.B., Guo, S., and Peterlin, B.M.
- Source
- Full text @ Proc. Natl. Acad. Sci. USA
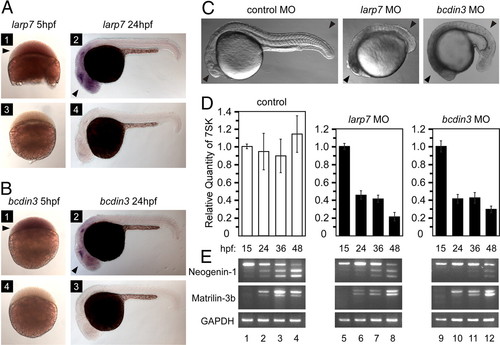
Knockdown of larp7 and bcdin3 in zebrafish caused developmental defects, decreased 7SK levels, and aberrant splicing. (A and B) RNA in situ hybridizations of whole-mount zebrafish embryos by using larp7 and bcdin3 antisense (1, 2) and sense probes (3, 4) at the indicated time points. Black arrowheads in panels 1 and 2 indicate larp7 and bcdin3 expressions in blastomeres and their enriched expressions in developing brain/head, respectively. (C) Zebrafish embryos injected with either larp7 MO or bcdin3 MO show developmental defects at 24 hpf compared with embryo injected with a control MO. Black arrowheads indicate the developing brain/head and trunk/tail. (D) Relative quantities of 7SK levels were determined by RT-qPCR at the indicated time points below the graph. The error bars represent the mean ± SD. (E) Splicing pattern analysis for the 2 genes indicated on the left at different time points as shown above the agarose gels. Levels of splicing variants were determined by RT-PCR by using the samples as in D and gene-specific primers. EXPRESSION / LABELING:
PHENOTYPE:
|
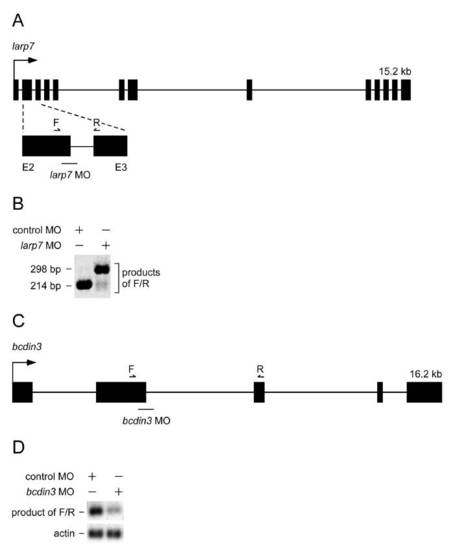
Gene structure and efficacies of larp7 and bcdin3 MOs. (A) Schematic representation of the D.rerio larp7 gene. Arrow represents the transcription start site. Exons are presented as black rectangles and introns as solid lines. The lower part of the schematic shows the enlarged region of the gene with exons 2 and 3 and the intron 2. The position of larp7 MO is indicated below the schematic and the primers used for assessing the MO efficacy are indicated above. (B) Efficacy of larp7 MO was determined by RT-PCR with the indicated primers in the schematic of A by using total RNA samples from control MO- or larp7 MO-injected zebrafish embryos. (C) Schematic representation of the D. rerio bcdin3 gene. Arrow represents the transcription start site. Exons are presented as black rectangles and introns as solid lines. The position of bcdin3 MO is indicated below the schematic and the primers used for assessing the MO efficacy are indicated above. (D) Efficacy of bcdin3 MO was determined by RT-PCR with the indicated primers in the schematic of panel C by using total RNA samples from control MO-or bcdin3 MO-injected zebrafish embryos. |