
- Title
-
Different roles for KIF17 and kinesin II in photoreceptor development and maintenance
- Authors
- Insinna, C., Humby, M., Sedmak, T., Wolfrum, U., and Besharse, J.C.
- Source
- Full text @ Dev. Dyn.
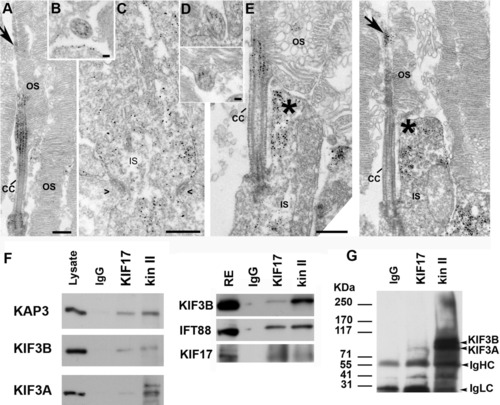
KIF17 and kinesin II localization and co-immunoprecipitation. A-C: Immuno-electron microscopy (EM) localization of the KAP3 subunit of kinesin II in mouse rod photoreceptor cells. A: Longitudinal section through the connecting cilium and parts of the outer segment (OS). B: Cross-section through the connecting cilium (CC). C: Section through in the endoplasmic reticululm (ER) -Golgi region of the IS. Symbols (><) indicate position of adherens junctions at the outer limiting membrane. D,E: Immuno-EM localization of KIF17. D: Two slightly oblique sections through the CC. E: Two longitudinal images through the photoreceptor at the level of the CC. Arrow points to labeling in the axoneme of the OS. Asterisks indicate labeling in the collar-like extension of the apical IS. F: Co-immunoprecipitation from mouse retinal extracts of either kinesin II or KIF17 with IFT88. IP antibodies are shown at the top. Western blots were done with antibodies for KIF17, IFT88, and the three kinesin II subunits (KAP3, KIF3B, and KIF3A); antibodies are shown on the left. A mixture of IgGs was used as control for nonspecific binding. G: IP experiment as in F from zebrafish retinal extract; the kinesin II antibody (K2.4) recognizes both KIF3A and KIF3B. Scale bars = 400 nm in A, 50 nm in B, 400 nm in C, 50 nm in D (upper), 100 nm in D (lower), 400 nm in E. |

Disruption of kif3B expression by an antisense morpholino oligonucleotide. A: (Upper panel) Images of 3-day-old larvae that survived an injection of 500 μM (AKIF3B 500 μM) or 250 μM (AKIF3B 250 μM) of the translation-blocking morpholino. (Middle panel) A control injected embryo. (Lower panel) Three-day-old larva after injection with 250 μM of a splice-blocking morpholino (SpKIF3B). B: Western blots of whole embryo extracts showing the reduction of KIF3B and KIF3A in AKIF3B morphants at 3 days postfertilization (dpf); anti-KIF17 and anti-γ-tubulin were used as controls. C: Western blot of three separate whole SpKif3B (250 μM) morphant and control embryo extracts showing similar depletion of KIF3B and KIF3A as observed in translation-blocking morphants (B above); anti-γ-tubulin was used as a loading control. D: Semi-thin section of the eye of an AKIF3B (250 μM) morphant at 3 dpf. Insets: Electron microscopy (EM) views of AKIF3B (250 μM) photoreceptors. E: Semi-thin section of the eye of an AKIF3B (500 μM) morphant at 3 dpf. Note the absence of retinal lamination and photoreceptor differentiation. Scale bar = 10 μm in D,E, 2.5 μm in insets. EXPRESSION / LABELING:
PHENOTYPE:
|
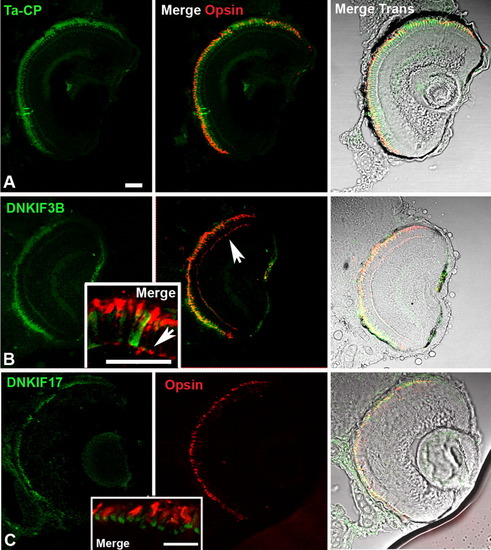
Localization of Ta-CP-directed expression of green fluorescent protein (GFP), DNKIF3B, and DNKIF17 and cone opsin localization at 5 days postfertilization (dpf). The Ta-CP promoter up stream of GFP, DNKIF3B, or DNKIF17 was injected at the one-cell stage. A: In Ta-CP/GFP embryos, GFP fluorescence was seen throughout the outer retina and cone opsin was highly localized to the outer segment (OS). B: In Ta-CP/DNKIF3B embryos, transgene expression (GFP, green) was similar to controls, but cone opsin was mislocalized to the perinuclear region and outer plexiform layer (arrow) across the entire retina. Inset: Higher power image showing cone opsin mislocalization to the synaptic layer (arrow). C: In Ta-CP/DNKIF17 embryos transgene expression (GFP, green) was distributed across the entire retina, but was largely restricted to the inner segment (IS; see inset). Cone opsin was in the OS, and there was no evidence of mislocalization. Inset: Higher power image showing lack of mislocalization of cone opsin and strong accumulation of DNKIF17 in the IS. Scale bars = 10 μm. The bar in A applies to panels A-C. |
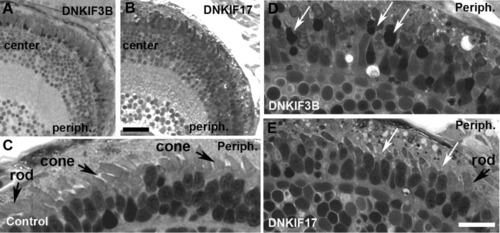
Light microscopy of retinae of control, DNKIF3B, and DNKIF17 embryos at 5 days postfertilization (dpf). A,B: Low power images of semi-thin plastic sections of DNKIF3B (A) and DNKIF17 (B) eyes. Central (center) and peripheral (periph) retinal regions are labeled. C: Higher power image of the outer retina of a control eye; the periphery is on the right (Periph). Cone and rod outer segment (OS) are indicated by arrows. D,E: Higher power images of outer retina of DNKIF3B (D) and DNKIF17 (E) eyes; the periphery is on the right (periph). White arrows in D indicate condensed nuclei and cell bodies of dying cones. White arrows in E indicate cones with very short or missing OS. A normal rod OS is indicated in E. Scale bars = 10 μm. The bar in E applies to C-E. |
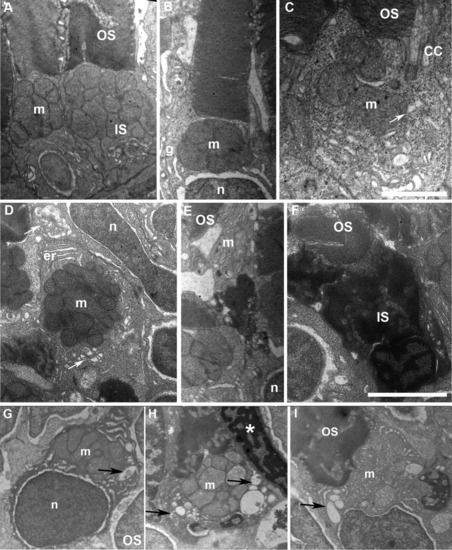
Accumulation of large vacuoles and dense material in the inner segment (IS) of cones expressing DNKIF3B. A: Electron microscopy (EM) view of cones at 5 days after injection of the Ta-CP driving green fluorescent protein (GFP) alone (control). Note the normal structure of outer segment (OS) discs and IS with accumulation of mitochondria (m) in the ellipsoid region. B,C: EM view of cones at 5 days after injection of the Ta-CP driving DNKIF3B showing mild IS defects. This was primarily enlargement of the cytoplasmic area around the mitochondria. Arrow indicates large vesicle below the connecting cilium (CC). n, photoreceptor nucleus; g, Golgi apparatus. D: EM view of a cross-section through the IS of a cone with a mild IS phenotype involving enlargement of the cytoplasmic area around mitochondria; er, endoplasmic reticulum. The upper arrow indicates accumulation of large vesicles in the ellipsoid region. The lower arrow indicates a Golgi region. E: EM view of a cone in the central retina that has a highly condensed IS between the nucleus (n) and mitochondrial rich (m) ellipsoid region. OS discs are normal. F: Cone with a highly condensed nucleus and IS with normal OS organization. G,H: Examples of cones accumulating vesicles and large vacuoles (arrows) within the IS surrounding the mitochondria. Asterisk in H indicates condensed nucleus of an adjacent cone. Scale bar = 1.5 μm in C, 2.5 μm in F. |
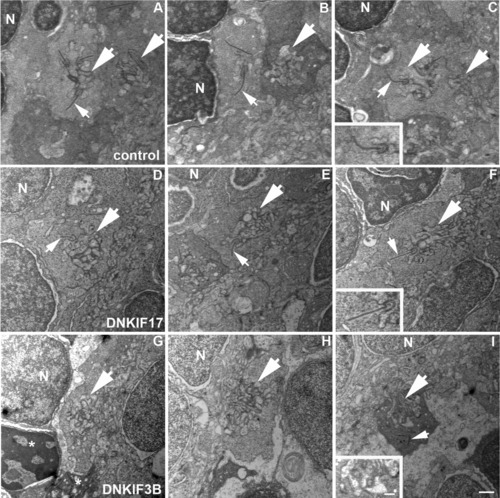
Lack of synaptic ribbons in cone pedicles of DNKIF3B-expressing embryos. A-C: Control pedicles showing postsynaptic invaginations (large arrows) and synaptic ribbons (small arrows) associated with presynaptic membranes. D-F: DNKIF17 cone pedicles showing postsynaptic invaginations (large arrows) and synaptic ribbons (small arrows) associated with presynaptic membranes. G-I: DNKIF3B cone pedicles showing postsynaptic invaginations (large arrows) without synaptic ribbons. Occasionally, ribbons are seen dissociated from presynaptic membranes (small arrow in I). Condensed nuclei and pedicles (asterisks) of dying cells are seen in G. Insets in C, F, and I are enlargements of invaginations to show association of ribbons with the presynaptic membrane. Scale bars = 500 nm in I and in inset. |
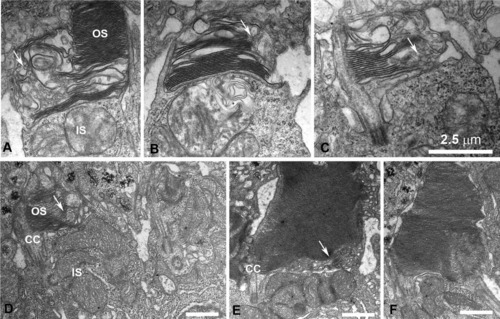
Disruption of the outer segment (OS) structure in cones expressing DNKIF17. A-D: Electron microscopy (EM) views of cones at the retinal periphery at 5 days after injection of Ta-CP driving DNKIF17. Note disrupted OS structure with failure to complete disc edges as shown by arrows. E: EM view of a cone in the central retina accumulating vesicular membranes within the base of the OS (arrows) opposite the cilium (CC). F: Normal rod photoreceptor. Scale bars = 2.5 μm in C (applies to A-C). |