
- Title
-
O-GlcNAc modifications regulate cell survival and epiboly during zebrafish development
- Authors
- Webster, D.M., Teo, C.F., Sun, Y., Wloga, D., Gay, S., Klonowski, K.D., Wells, L., and Dougan, S.T.
- Source
- Full text @ BMC Dev. Biol.
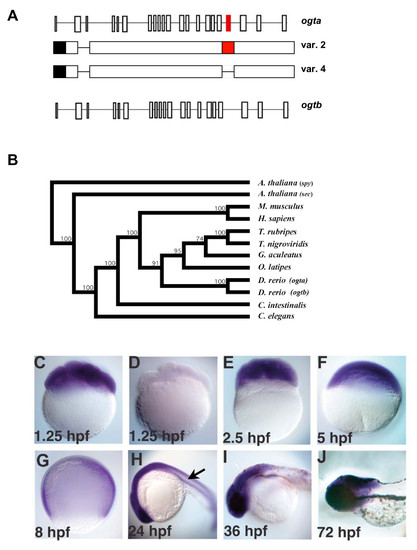
The origin and expression pattern of zebrafish ogt genes. (A) Schematic diagram of zebrafish ogta and ogtb loci (formerly known as copy I and copy II, respectively), which are located on Chromosome 14 [46]. Diagrams of variant 2 and 4 transcripts from the ogta gene are represented under the diagram of the ogta locus. The black box represents the 3′ UTR, while the red boxes in the ogta locus and variant 2 transcript represent the alternatively spliced exon 19, which has been proposed to inhibit O-GlcNAc Transferase activity [46]. Exon 19 is absent from variant 4 transcripts. (B) Phylogenetic analysis of ogt genes constructed using the neighbor-joining method using aligned amino acid sequences (see materials and methods for gene identifier numbers for each of the sequences used). The A. thaliana ogt gene spy was used to root the tree, since it is the most divergent ogt gene we analyzed. Bootstrap values for 1,000 repetitions are indicated at the nodes. (C-J) A time course of ogt gene expression from 8-cell (1.25 hpf) (C) to 72 hpf (J) of development reveals that ogt is dynamically expressed in early embryos. ogt is ubiquitously expressed in cleavage stage (C, E), blastula stage (F) and gastrula stage (G) embryos. Signal is not detected in embryos incubated with sense probe (D). At 24 hpf, ogt transcripts are expressed at high levels in the brain and lower levels trunk and tail (H). At 36 hpf (I) and 72 hpf (J), ogt transcripts are restricted to the brain. EXPRESSION / LABELING:
|
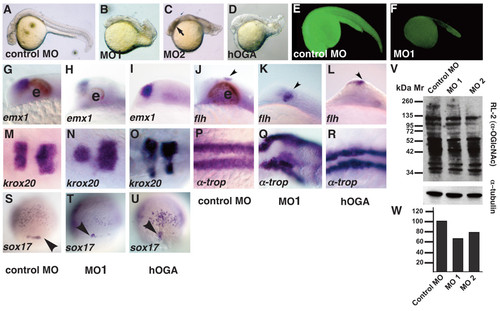
Tissues from all three germ layers are reduced in ogt morphants. Comparison of ogt morphants and hOga expressing embryos with controls at 24 hpf (A-R) or 8 hpf (S-U). (B) Embryos injected with 7.5 ng MO1 (B), MO2 (C) or hOga (D) were smaller than controls (A), and had curved tails, small brains, reduced or absent eyes and shortened body axes. Necrotic tissue in the head from the MO injection is indicated (C, arrow)[86]. An Ogt-gfp fusion protein is translated in the presence of control MOs (E), but not in the presence of MO1 (F). In embryos injected with MO1 (H, K, arrowhead) or hOga (I, L, arrowhead), emx1 expression is slightly reduced compared to controls (G) and flh expression in the epiphysis is normal or slightly expanded. krox20 is expression is reduced in ogt morphants (N) and hOga expressing embryos (O). α-tropomyosin is reduced and disorganized in ogt morphants (Q) and hOga overexpressing embryos (R), reflecting the disorganization of the entire body axis. Fewer sox17 expressing endodermal precursor cells and dorsal forerunner cells are apparent in ogt morphants (T, arrowhead) and hOga overexpressing embryos (U, arrowhead). (V) Extracts from embryos injected with control MO (lane 1), MO1 (lane 2) or MO2 (lane 3) were probed with the RL2 monoclonal antibody (upper) or anti-tubulin antibody (lower). (W) Embryos injected with the control MO have 35% more O-GlcNAc modified protein than embryos injected with MO1 and 20% more than embryos injected with MO2. Anterior is to the left in A-R, dorsal views in S-U. e = eyes. Representative embryos are shown. EXPRESSION / LABELING:
PHENOTYPE:
|
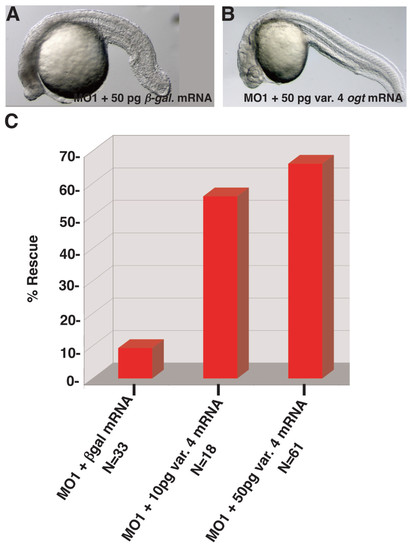
Rescue of ogt morphants by injection of variant 4 ogt mRNA. Lateral views of live ogt morphant injected with 50 pg β-galactosidase mRNA (A) or 50 pg ogta variant 4 mRNA (B). The image in A depicts the mild range of defects observed in morphants. (C) Graph depicting the frequency of wild type embryos in ogt morphants injected with 50 pg β-galactosidase mRNA (lane 1), 10 pg ogta variant 4 mRNA (lane 2), or 50 pg variant 4 ogt mRNA (lane 3). Injection of ogta variant 4 mRNA significantly increases the frequency of normal embryos. |

Induction of mesoderm and endoderm are normal in ogt morphants. Animal pole views of 5 hpf embryos (A, B, E, F) or dorsal views of 6 hpf embryos (C, D). ntl is expressed in the ring mesoderm and endodermal precursors around the margin in control MO (A) and MO1 (B) injected embryos. gsc (C, D) is expressed in dorsal marginal cells in ogt morphants (O) and controls (C). The mezzo transcription factor is expressed in a ring of endoderm precursors in control embryos (E). mezzo expression in the morphants is indistinguishable from controls (F). EXPRESSION / LABELING:
|
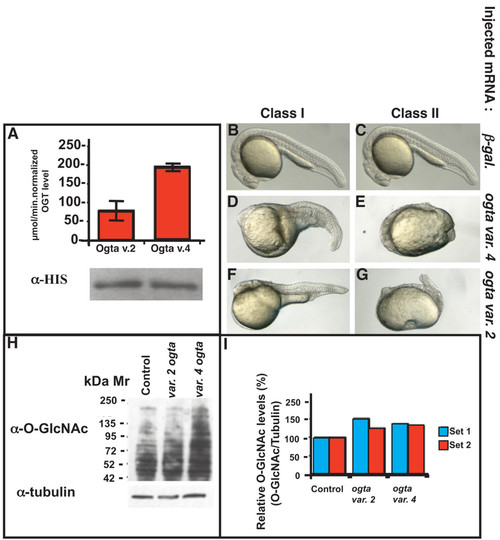
Variant 2 and variant 4 Ogta proteins are active in vitro and in vivo. (A) in vitro Ogt activity assay of bacterially expressed, HIS-tagged variant 2 Ogta and variant 4 Ogta proteins. Both enzymes incorporate significant amounts of [3H]UDP-GlcNAc onto the synthetic CKII peptide identical to the human sequence, although variant 4 Ogta is more active than variant 2. A western blot of the bacterial lysates reveals that equivalent amounts of enzyme were added to the reactions. (B-G) Images of live 24 hpf embryos injected with 500 pg β-galactosidase mRNA (B, C), variant 4 ogta mRNA (D, E), or variant 2 ogt (F, G). Embryos injected with β-galactosidase mRNA developed normally (B, C). Overexpression of variant 4 ogta mRNA resulted in three phenotypic classes of embryos at this stage. Class I embryos had a visible, but shortened, body axis and reduced brain, including reduced or absent eyes (D). The body axis in Class II embryos was strongly reduced and in many cases, not discernable (E). Class III embryos are indistinguishable from wild type (not shown). Expression of variant 2 ogta mRNA produced the same range of phenotypes, including Class I (F) and Class II (G) embryos. (H, I) Western blot of protein extracts of 18 hpf embryos injected with 500 pg mRNA encoding β-galactosidase (lane 1), variant 2 ogta (lane 2), variant 4 ogta (lane 3). The blot was probed with the RL2 antibody, which recognizes the O-GlcNAc modification. This experiment was performed in biological duplicate (I) Quantification of the blot shown in (H, set 1) and a technical duplicate (set 2). B and C are duplicate images of the same control embryo. |
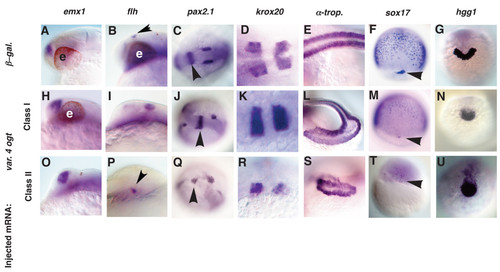
Tissues from all three germ layers are reduced in Ogt overexpressing embryos. Analysis of defects in Class I (H-N) and Class II (O-U) Ogt overexpressing embryos, compared to controls (A-G). Embryos at 24 hpf (A-E, H-L, O-S), 8 hpf (F, M, T) and 14 hpf (G, N, U) are shown. emx1 expression in class I (H) and class II (O) embryos is indistinguishable from controls (A). flh expression is slightly expanded in class I (I, arrowhead) and reduced in class II (P, arrowhead) embryos. In class I embryos, pax2.1 expression is normal in the MHB (J, arrowhead), whereas the otic vesicles are often disrupted (J). In class II embryos, pax2.1 expression is disrupted in the MHB (Q, arrowhead) and the otic vesicles are reduced or absent (Q). krox20 expression in rhombomeres 3 and 5 is indistinguishable in class I embryos (K) and controls (D). The rhombomeres are reduced and disrupted in class II embryos (R). α-tropomyosin expression is reduced and disorganized in class I embryos (L) and more severely reduced and disorganized in class II embryos (S). sox17 expression in endodermal precursors and dorsal forerunner cells is reduced in class I embryos (M) and severely reduced or absent in class II embryos (T) (arrowheads mark the forerunner cells). hgg1 is reduced in class I (N) and class II (U) embryos. Anterior to the left in A-E, H-L, O-S, dorsal views in F, M, T, and anterior views in G, N, U. e = eyes. EXPRESSION / LABELING:
|

Altering O-GlcNAc levels causes increased cell death. Flow cytometry of dissociated cells from 18 hpf embryos. (A) Distribution of cells from uninjected embryos showing the position of non-fluorescent cells and debris. (B) Distribution of cells from embryos injected with β-galactosidase mRNA/FITC-dextran. The box indicates FITC positive cells between 5–10 μm in diameter. (C) Distribution of cells from embryos injected with variant 4 ogta mRNA/AlexaFluor-647-dextran. The box indicates AlexaFluor-647 positive cells between 5–10 μm in diameter. (D) Embryos injected with β-galactosidase mRNA/FITC-dextran and variant 4 ogta mRNA/AlexaFluor-647-dextran were mixed, dissociated, and fluorescent cells between 5–10 μm diameter were counted. In this experiment, we counted 67,711 FITC positive cells and 43,213 AlexaFluor-647 positive cells. (E-H) Images of live 10 hpf embryos stained with acridine orange, which labels dying cells. All embryos are oriented with the tailbud at the bottom of the panel. (E) In controls, only a few acridine orange positive cells are detected, indicating a low rate of cell death. By contrast, a large number of acridine orange positive cells are observed in ogt morphants (F), Ogt overexpressing embryos (G) and hOga overexpressing embryos (H), indicating a high rate of cell death. |

Mesodermal derivatives are disorganized in Ogt expressing embryos. Images of fixed embryos processed for in situ hybridization to reveal expression of ntl at 10 hpf (A-C) or MyoD at 14 hpf (D-F). At 10 hpf, ntl is expressed in the axial mesoderm in controls (A). ntl expression is truncated (B) in class I embryos, and more severely truncated in class II embryos (C). MyoD marks trunk somites on either side of the midline at 14 hpf (D). Some somites are missing in class I embryos, but many of the remaining somites are abnormally wide (E). In class II embryos, somites extend around the circumference of the embryos (F). EXPRESSION / LABELING:
|
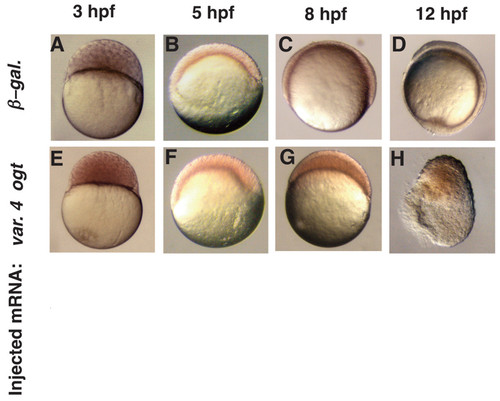
Epiboly is delayed in Ogt expressing embryos. A live time-course embryonic development of an embryo injected with β-galactosidase mRNA (A-D) or a sibling injected with encoding variant 4 ogt mRNA (E-H) at 3 hpf (A, E), 5 hpf (B, F), 8 hpf (C, G) and 12 hpf (D, H). Progression through the cleavage stages in ogt overexpressing embryos (E) is indistinguishable from controls (E). Epiboly initiates normally when Ogt is overexpressed, and these embryos reach 40% epiboly at 5 hpf (B), the same as controls (F). Ogt overexpressing embryos are stalled at 40% epiboly at 8 hpf (G), when controls are at 75% epiboly (G). Control embryos complete epiboly at 10 hpf and reach the 3 somite stage at 12 hpf (D). The most severely affected Ogt overexpressing embryos never complete epiboly and begin to degenerate at 12 hpf (H). |

Ogt overexpressing embryos have defects in the yolk cytoskeleton. Confocal z-stacks of immunofluorescent images of embryos injected with β-galactosidase mRNA (A, D, G, J), variant 4 ogt mRNA (B, E, H, K) and hOga mRNA (C, F, I, L). Embryos at 4 hpf were incubated with the 12G10 1° antibody to reveal microtubule filaments (A-F) and 8 hpf embryos were incubated with rhodamine phalloidin (G-L). 12G10 reactivity reveals mitotic spindles in the blastomeres of controls embryos (A) Ogt expressing embryos (B) and hOga embryos (C). Within the yolk, long MT arrays extend around through the cortical cytoplasm toward the vegetal pole (A, D, arrowhead). In Ogt expressing embryos, many MTs appear thicker than normal and the arrays do not extend far towards the vegetal pole (B, E, arrowhead). Similarly, the MTs in the yolk are thicker than normal in hOga expressing embryos (F, arrowhead). Staining with rhodamine-phalloidin reveals actin filaments associated with the plasma membranes of EVL cells and the contractile actin ring in the yolk syncytial layer (YSL) (G-L). The contractile actin ring is apparent within the YSL of controls (G, J arrow), but not in OGT overexpressing embryos (H, K, arrow) or hOga expressing embryos (I, L, arrow). The EVL cells are highly irregular in size and shape in Ogt overexpressing embryos (H, K) and hOga expressing embryos (I, L). Red lines indicate the position of the YSL (A-C). Animal pole is to the top. Bars = 100 μm. |
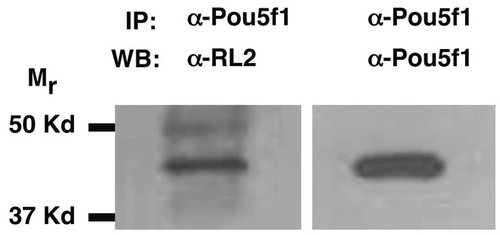
Pou5f1 is modified by O-GlcNAc in human embryonic stem cells. Western blot of protein immunoprecipitated by an anti-Pou5f1 antibody. The RL2 antibody recognizes a 43 KDa, O-GlcNAc modified protein that is immunoprecipitated from the nucleocytosolic fraction of human ES cells (line BG02) by an anti-Pou5f1 antibody. The immunoprecipitation was specific, since the nucleocytosolic fraction was precleared with a mixture of IgG and A/G PLUS agarose prior to incubation with the anti-Pou5f1 antibody. The anti-Pou5f1 antibody recognizes the same band when the blot is stripped and reprobed, confirming that Pou5f1 protein is modified by O-GlcNAc. |

Unillustrated author statements EXPRESSION / LABELING:
|