- Title
-
Heterochronic shift in Hox-mediated activation of sonic hedgehog leads to morphological changes during fin development
- Authors
- Sakamoto, K., Onimaru, K., Munakata, K., Suda, N., Tamura, M., Ochi, H., and Tanaka, M.
- Source
- Full text @ PLoS One
|
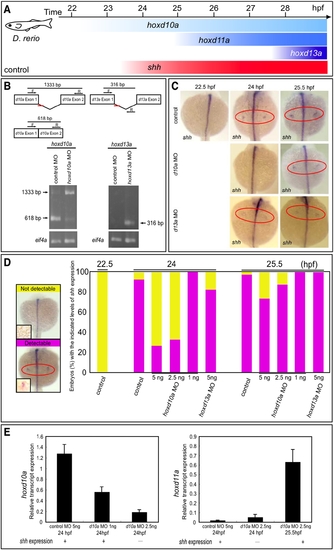
Timing of shh expression in zebrafish embryo fin primordia depends on hox transcript accumulation. (A) Schematic representation of temporal hox and shh expression in the pectoral fin primordia of zebrafish embryos. shh was expressed at 24 hpf concomitantly with hoxd10a expression. (B) RT-PCR analysis to determine the efficiency of the hoxd10a or hoxd13a splice-blocking morpholino (MO). In the schematics, arrows represent forward (F) and reverse (R) primers, and the short red bars represent the hoxd10a MO and hoxd13a MO. Lower panel, analysis of RT-PCR products by agarose gel electrophoresis. Products of 618 bp and 1333 bp represent spliced and unspliced hoxd10a mRNA, respectively. The 316-bp RT-PCR product represents spliced hoxd13a mRNA. Amplification of eif4a cDNA was used as a control. (C) Whole-mount in situ hybridization to detect shh expression in the pectoral fin primordia of D. rerio embryos injected with 5 ng control MO (top panels), 5 ng hoxd10a MO (middle panels) or 5 ng hoxd13a MO (bottom panels) at the indicated hpf. Red ovals highlight the pectoral fin primordia. Note that shh expression was first observed at 24 hpf in the fin primordia of embryos injected with control (top) or hoxd13a MO (bottom), whereas shh transcripts became detectable at 25.5 hpf in the primordia of most embryos injected with hoxd10a MO (middle). (D) Percentages of embryos with detectable or undetectable levels of shh expression observed at 22.5, 24, and 25.5 hpf following injection of control MO, hoxd10a MO or hoxd13a MO (see also Figure S4). A representative image depicting the detectable or undetectable levels of shh expression in the pectoral fin primordia is shown at the left. Insets show high magnification views of pectoral fin primordia. (E) Semi-quantitative RT-PCR analysis to determine the expression levels of 5′ hoxd when shh is transcribed in pectoral fin buds. The relative levels of hoxd10a and hoxd11a transcripts in the lateral plate mesoderm of morphants were quantified. Relative expression was normalized against gapdh transcripts. EXPRESSION / LABELING:
|
|
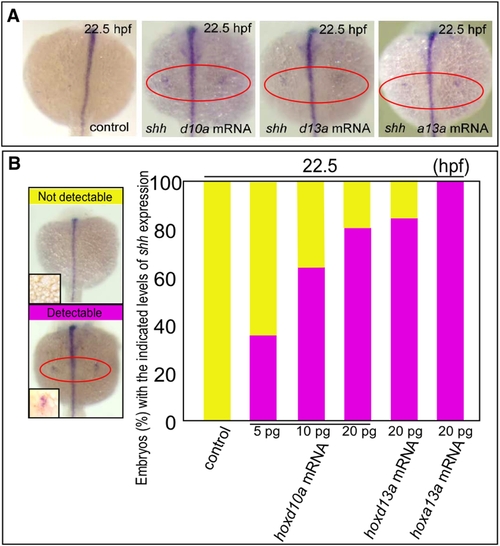
hox transcript accumulation is critical for the onset of shh expression in fin development. (A) Expression of shh in pectoral fin primordia of D. rerio embryos injected with 5 ng control MO, 20 pg hoxd10a mRNA, 20 pg hoxd13a mRNA or 20 pg hoxa13a mRNA at 22.5 hpf. Red ovals highlight the pectoral fin primordia. Note that transcripts of shh became detectable at 22.5 hpf in the fin primordia of embryos injected with hoxd10a, hoxd13a or hoxa13a mRNA. (B) The percentage of embryos with the indicated level of shh expression at 22.5 hpf following injection of control MO, hoxd10a mRNA, hoxd13a mRNA or hoxa13a mRNA is shown in the bottom panel (see also Figure S4). A representative image depicting the detectable or undetectable levels of shh expression in the pectoral fin primordia is shown at the left. |
|
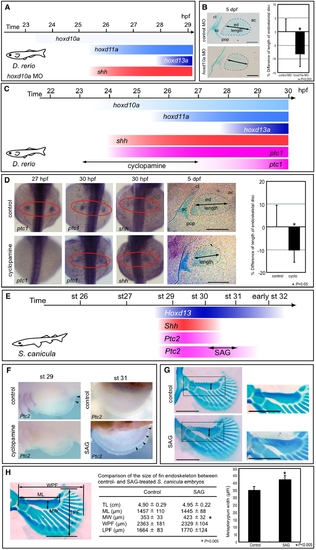
Temporal shift of Shh activity leads to changes in pectoral fin morphology. (A) shh expression appears at 25.5 hpf in pectoral fin primordia of D. rerio embryos injected with 5 ng of hoxd10a MO. (B) At 5 dpf, pectoral fins of embryos injected with control MO or with hoxd10a MO were stained with Alcian Blue (left). Cleithrum (cl), scapulocoracoid (sc), postcoracoid process (pop), endoskeletal disc (ed) and actinotrichs (ac) are indicated. Scale bars: 100 μm. The relative lengths of the endoskeletal disc are presented in the graph (right). *P<0.001, as assessed by Student's t-test. (C) shh expression appears at 24 hpf, concomitantly with hoxd10a, in pectoral fin primordia of D. rerio. Hedgehog signaling was blocked by treatment with 60 μM cyclopamine from 23 to 27 hpf, resulting in ablation of ptc1 expression until at least 27 hpf. ptc1 expression was recovered by 30 hpf in pectoral fin primordia of cyclopamine-treated embryos. (D) ptc1 and shh expression were examined in control or cyclopamine-treated embryos at the indicated stages (left). At 5 dpf, pectoral fins of control or cyclopamine-treated embryos were stained with Alcian Blue (middle). Scale bars: 200 μm. The relative lengths of the endoskeletal disc are represented in a graph (right). *P<0.05, as assessed by Student's t-test with Welch's correction. (E) Shh and Ptc2 expression disappeared before stage 31 in pectoral fin buds of S. canicula embryos. Hedgehog signaling was extended by treatment with SAG for 6 days from stage 30 to 31, resulting in extension of Ptc2 expression until at least stage 31. (F) Ptc2 expression was examined in control or SAG-treated embryos at stage 31 (5 days after the initial treatment). (G) Pectoral fins of control or SAG-treated embryos were stained with Alcian Blue. Anterior is to the left. Proximal is to the top. Insets show magnified views of the pectoral fin metapterygium. Note that the width of the metapterygium (arrows) of SAG-treated embryos was significantly increased. Scale bars: 1 mm. (H) Comparison of the size of the pectoral fin endoskeleton between control and SAG-treated S. canicula embryos. The table shows the total body length (TL), metapterygium length (ML), metapterygium width (MW), width across the base of pectoral fin endoskeleton (WPF), and length of pectoral fin endoskeleton (LPF) of control and SAG-treated embryos. The metapterygium lengths are represented in the bar graph. *P<0.05, as assessed by Student's t-test. |
|
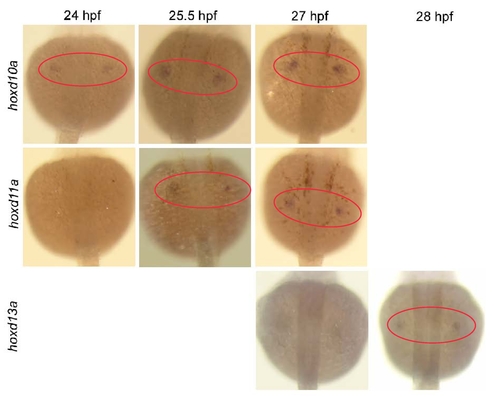
Expression of hoxd10a, hoxd11a and hoxd13a during D. rerio pectoral fin development. Dorsal view of embryos injected with 5 ng of the control morpholino (MO) at 24, 25.5, 27 and 28 hpf. Red ovals highlight the pectoral fin primordia. Expression of hoxd10a was initially detected at 24 hpf, hoxd11a at 25.5 hpf, and hoxd13a at 28 hpf. |
|
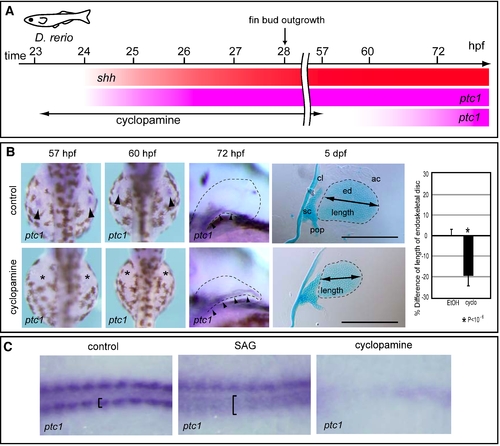
Treatment of zebrafish embryos with cyclopamine or SAG. (A) Hedgehog signaling was blocked by treatment with 60 μM cyclopamine from 23 to 57 hpf, resulting in ablation of ptc1 expression until at least 60 hpf. ptc1 expression recovered by 72 hpf in pectoral fin primordia of cyclopamine-treated embryos. (B) ptc1 expression was examined in control or cyclopamine-treated embryos at the indicated stages (left). At 5 dpf, pectoral fins of control (n = 7) or cyclopamine-treated embryos (n = 9) were stained with Alcian Blue (middle). The relative lengths of the endoskeletal disc are presented in the graph (right). *P<10-6, as assessed by Student's t-test. Cleithrum (cl), scapulocoracoid (sc), postcoracoid process (pop), endoskeletal disc (ed) and actinotrichs (ac) are indicated. Scale bars: 200 μm. (C) Zebrafish embryos were treated with SAG or cyclopamine, and ptc1 expression was examined in adaxial cells. The specification of adaxial cells is known to depend on Hh signaling [1]. Panels show the dorsal view of ptc1 expression in an 8-somite-stage control embryo (left), in a SAG-treated embryo (middle), and in a cyclopamine-treated embryo (right). In control embryo, adaxial cells are indicated by brackets. Note that ptc1 expression is expanded in the SAG-treated embryo (brackets), whereas it is undetectable in the cyclopamine-treated embryo (right). 1. Wolff C, Roy S, Ingham PW (2003) Multiple muscle cell identities induced by distinct levels and timing of hedgehog activity in the zebrafish embryo. Curr Biol 13: 1169–1181. |

