- Title
-
Endothelial cells promote migration and proliferation of enteric neural crest cells via beta1 integrin signaling
- Authors
- Nagy, N., Mwizerwa, O., Yaniv, K., Carmel, L., Pieretti-Vanmarcke, R., Weinstein, B.M., and Goldstein, A.M.
- Source
- Full text @ Dev. Biol.
|
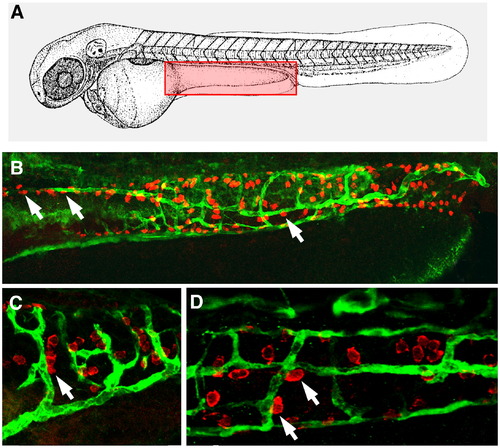
Enteric neural crest cells align with blood vessels in the zebrafish gut. (A) Diagram of a zebrafish embryo with red box depicting the approximate area of the gut imaged in panels B–D. (B) Hu+ ENCCs (red) are seen in close proximity to EGF-labeled ECs (green) in 6 dpf TG(fli1:EGFP) wild-type embryos (white arrows). This colocalization is present in both mid- (C) and posterior intestine (D). |
|
Subintestinal vessels (SIVs) form ahead of enteric neurons in zebrafish embryos. (A) Diagram of a zebrafish embryo with red box depicting the approximate area of the yolk extension, gut, and trunk imaged in panels B-I. Confocal images of corresponding areas of fli:EGFP (B,D,F,H) and HuC:EGFP (C,E,G,I) transgenic embryos at the same stages of development. At 2 dpf, the subintestinal vascular network is seen along the yolk extension (B, arrow), whereas no enteric neurons are detected in this area at the same developmental stage (C). At 3 dpf, a few enteric neurons (E, arrow) have reached the dorsal aspect of the yolk extension. At 4 dpf (F,G) and 6 dpf (H,I), larger numbers of neurons have arrived, and the SIVs and ENS cells now surround a well-formed intestine. In panels E,G,I, confocal stacks were used to specifically identify ENCC-derived GFP signal in the background of green yolk autofluorescence. Hu-labeled cells were then manually colored red in reconstructed images to facilitate visualization. dpf, days post-fertilization; y.e., yolk extension; SIVs, subintestinal vessels. The image in panel A is modified from (Kimmel et al., 1995). |
|
The juxtaposition of ENCCs and vessels in the zebrafish intestine is non-random. Gut region of a Tg(fli:EGFP) embryo at 5 dpf, showing enteric neurons (A,C; HuC, red) and subintestinal vessels (B,D; EGFP, green). Neurons (C) and vessels (D) of each imaged gut (n = 10) were traced using a software tool developed in Matlab© for the purpose of quantifying the proximity of enteric neurons to endothelial cells. Briefly, the distance of each neuron from its proximal blood vessel is computed. The tendency of the neurons to concentrate in the vicinity of the blood vessels is measured by the sum of these distances (Sum of Shortest Distances, or SSD). We tested the significance of the non-uniform spatial distribution of the neurons by estimating the probability distribution function of the SSD for uniformly distributed neurons (shown as bell-shaped curve in E) and comparing it to the experimentally observed SSD, noted by the arrow on the graph in panel (E). The random distribution was computed by keeping the number of neurons fixed (equal to the experimentally measured number), repeatedly assigning random coordinates to the neurons to simulate uniform spatial distribution, and then computing the SSD for each distribution, performing a total of 100,000 repetitions. The software reports a summary of the process (right of panel E), with information on the number of neurons and blood vessels, number of random repetitions, observed SSD, and p-value for the comparison between the random distribution and our experimental results. |
Reprinted from Developmental Biology, 330(2), Nagy, N., Mwizerwa, O., Yaniv, K., Carmel, L., Pieretti-Vanmarcke, R., Weinstein, B.M., and Goldstein, A.M., Endothelial cells promote migration and proliferation of enteric neural crest cells via beta1 integrin signaling, 263-272, Copyright (2009) with permission from Elsevier. Full text @ Dev. Biol.


