
- Title
-
A genetic screen for vascular mutants in zebrafish reveals dynamic roles for Vegf/Plcg1 signaling during artery development
- Authors
- Covassin, L.D., Siekmann, A.F., Kacergis, M.C., Laver, E., Moore, J.C., Villefranc, J.A., Weinstein, B.M., and Lawson, N.D.
- Source
- Full text @ Dev. Biol.

A transgenic haploid screen for vascular mutants. (A) Breeding strategy for transgenic haploid screen. (B) Transmitted light image of a Tg(fli1a:egfp)y1 haploid embryo. (C) Segmental arteries (red arrowheads) in a wild type Tg(fli1a:egfp)y1 haploid embryo. Red bracket denotes dorsal aorta. (D) Loss of segmental arteries in a y10 mutant haploid embryo. (E) Partial segmental artery sprouts (red arrowheads) in a y16 mutant haploid embryo. (F) Excessive segmental artery branching in a um7 mutant haploid embryo. (G) Loss of segmental artery formation and failure to form the dorsal aorta in a y11 haploid mutant embryo. (B–G) Lateral views, anterior to the left, dorsal is up. (C–E, G). Confocal fluorescent micrographs. (F) Epifluorescent image. (B) Scale bar is 250 μM. (C–G) Scale bar is 50 μM. |

Mutations in kdrl affect segmental artery formation. (A–D) Confocal fluorescent micrographs of zebrafish embryonic trunk blood vessels at 30 h post fertilization. Lateral views, anterior to the left, dorsal is up. Scale bar is 50 μM. (A) Wild type Tg(fli1a:egfp)y1 diploid sibling embryo. Arrowheads indicate DLAV. Arrows denote segmental arteries and dorsal aorta (DA) is indicated by a red bracket. (B) Segmental arteries in a kdrlum6;Tg(fli1a:egfp)y1 diploid mutant embryo. Partial segmental arteries indicated by white arrows. Red arrowheads indicate somite boundaries at which segmental arteries failed to sprout. Red bracket indicates a trunk vessel with a single lumen. (C) Partial segmental artery formation (white arrows) in a kdrlum19;Tg(fli1a:egfp)y1 diploid mutant embryo. A well-formed dorsal aorta (red bracket) is apparent in this embryo. (D) A kdrly17;Tg(fli1a:egfp)y1 diploid mutant embryo with both fully formed (indicated by asterisks) and partial segmental arteries (white arrows). The red arrow indicates region of the dorsal aorta that is discontinuous. (E) Quantification of sprout length in kdrl mutant embryos and their wild type siblings. (F) Location of the um6 mutation within the zebrafish Kdrl cytoplasmic domain. ClustalW alignment of conserved regions from Vegf-receptor-2/Kdr and Vegf-receptor-3/Flt4 from zebrafish (Dr), human (Hs), rat (Rn), and mouse. |
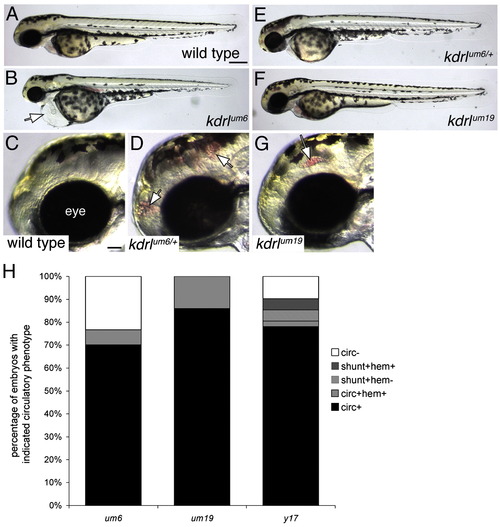
Defects in circulatory function in kdrl mutants. (A–G) Transmitted light images of wild type and kdrl mutant zebrafish embryos at 55 h post fertilization. Lateral views, anterior to the left, dorsal is up. (A) Wild type sibling embryo. Scale bar is 250 μM. (B) kdrlum6 mutant embryo displaying cardiac edema (white arrow). (C) Eye (indicated) and forebrain region of wild type sibling embryo. Scale bar is 50 μM. (D) Cranial hemorrhage (white arrows) in a heterozygous carrier of the kdrlum6 allele. (E) kdrlum6 heterozygous embryo. (F) kdrlum19 mutant embryo. (G) Eye and forebrain region of a kdrlum19 mutant embryo. A cranial hemorrhage is indicated by the white arrow. (H) Quantification of circulatory defects in clutches of embryos derived from incrosses of um6, um19, and y17 heterozygous carriers; circ — circulation, shunt — abnormal circulatory connection between dorsal aorta and posterior cardinal vein, hem — cranial hemorrhage. PHENOTYPE:
|

plcg1 is required for segmental artery formation. (A) Functional domains within Plcg1. PH — pleckstrin homology domain; X, Y — split catalytic domains; SH2 — src homology–2 domains; SH3 — src homology 3 domain. Residues affected by the y13 and y16 mutations are outlined in red and aligned with conserved sequences from other species (Dr — zebrafish, Hs — human, Dm — Drosophila, Mm — mouse). The y18 allele leads to a truncation in the X-catalytic domain. (B–E) Confocal fluorescent micrographs of trunk blood vessels at 30 h post fertilization. Lateral views, anterior to the left, dorsal is up. (B) Wild type sibling embryo. Scale bar is 50 μM. C. Loss of segmental arteries in a plcg1y13 mutant embryo. (D) Partial segmental arteries (white arrows) in a plcg1y16 mutant embryo. (E) plcg1y18 mutant embryo. (F) Position of point mutations engineered into rescue constructs in the Plcg1 SH2 and SH3 domains. (G) Graph indicating proportion of embryos displaying segmental artery or DLAV formation following injection with mRNA encoding the indicated Plcg1 construct. (H) Graph indicating proportion of embryos displaying partial or complete circulation following injection with mRNA encoding the indicated Plcg1 construct; SeA — segmental arteries, DLAV — dorsal longitudinal anastamotic vessel, circ — circulation, partial — shunt between dorsal aorta and posterior cardinal vein. |

Activation of Akt or MAPK signaling fails to rescue segmental artery formation in plcg1y13 mutant embryos. (A–I) Confocal fluorescent micrographs of trunk blood vessels at 30 h post fertilization. Anterior is to the left, dorsal is up. Scale bar is 60 μM. (A–C) Wild type Tg(fli1a:egfp)y1 embryo co-injected with 25 pg Tol2 transposase mRNA and pTol-fli1ep:mCher-actMAP2K1; arrow denotes excessive filopodial extensions in a sprout expressing high levels of the transgene; arrowhead is a low transgene-expressing cell. (D–F) Tg(fli1a:egfp)y1;plcg1y13 mutant embryo co-injected with 25 pg Tol2 transposase mRNA and pTol-fli1ep:mCher-actMAP2K1. (E, F) Arrows indicate transgene-expressing cells in the dorsal wall of the aorta. (G–I) Tg(fli1a:egfp)y1;plcg1y13 mutant embryo co-injected with 25 pg Tol2 transposase mRNA and pTol-fli1ep:mAkt-2A-mCher; (H, I) Arrows denote transgene-expressing cells in the dorsal aorta. |
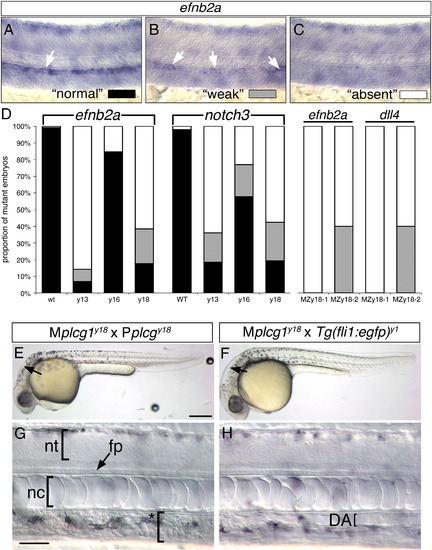
Artery differentiation defects in plcg1 mutants. (A–C) Classification schema to categorize level of artery marker gene expression in plcg1 mutant embryos. Differential interference contrast (DIC) images of zebrafish embryo trunks following whole mount in situ hybridization to detect ephrinb2a (efnb2a). (A) Normal ephrinb2a expression in the dorsal aorta (white arrow). (B) Weak ephrinb2a in distinct patches within the dorsal aorta (white arrows). (C) Loss of dorsal ephrinb2a expression classified as “absent”. (D) Quantification of artery marker gene expression in y13, y16, y18 and MPZy18 mutant embryos. (E, F) Transmitted light images of embryos at 30 hpf. Scale bar is 250 μM. (G, H) DIC images of embryos at 30 hpf. (E–H) Lateral views, anterior to the left, dorsal is up. (E, G) MPZplcg1y18 mutant embryo. Scale bar is 30 μM; nt — neural tube, fp — floor plate, nc — notochord. Asterisked bracket denoted absence of defined dorsal aorta or posterior cardinal vein. F, H. Mplcg1y18; Tg(fli1a:egfp)y1 mutant embryo; DA — dorsal aorta, indicated by a bracket. |
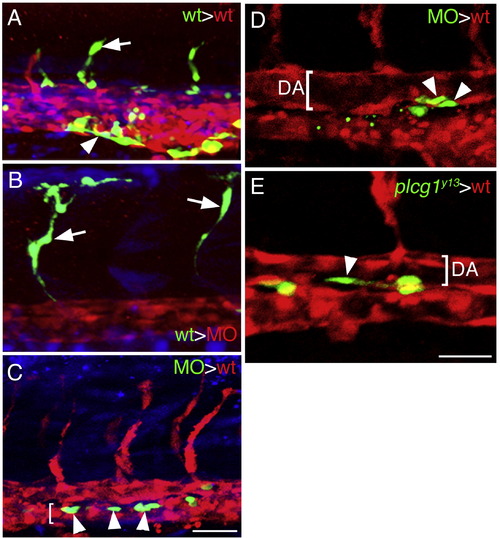
Plcg1 is required autonomously in endothelial cells for segmental artery sprouting. (A.–E) Confocal fluorescent micrographs of trunk blood vessels at approximately 27 hpf. Lateral views, anterior to the left, dorsal is up. In all images, host cells are expressing dsRedEx (red), while donor cells are expressing enhanced green fluorescent protein (green); in (A–C) donor cells are also labeled with Cascade Blue (blue). (A) Control embryo derived from transplantation of wild type donor Tg(fli1a:egfp)y1 cells into a Tg(fli1ep:dsredex)um13 host. Donor contribution to a developing segmental artery (white arrow) and the caudal vein (white arrowhead) is indicated. (B) Contribution of donor Tg(fli1a:egfp)y1 cells to a segmental artery (white arrow) in a plcg1 MO injected Tg(fli1ep:dsredex)um13 host. (C) Donor plcg1-MO injected Tg(fli1a:egfp)y1 cells (white arrows) within the posterior cardinal vein (lumen indicated by a white bracket) in a wild type Tg(fli1ep:dsredex)um13 host. (D) Donor plcg1-MO injected Tg(fli1a:egfp)y1 cells (white arrowheads) within the ventral wall of the dorsal aorta (DA, lumen denoted by a white bracket) in a wild type Tg(fli1ep:dsredex)um13 host. (E) Donor Tg(fli1a:egfp)y1;plcg1y13 mutant cells (white arrowheads) within the ventral wall of the dorsal aorta (DA, lumen denoted by a white bracket) in a wild type Tg(fli1ep:dsredex)um13 host. (A–C) Scale bar is 50 μM. (D, E) Scale bar is 30 μM. |
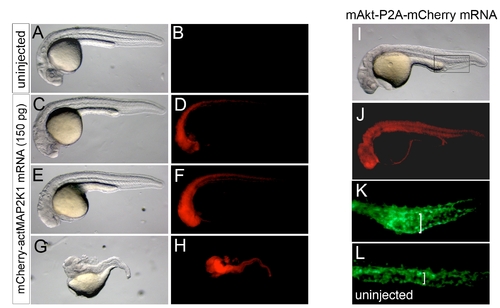
Developmental defects in embryos with constitutive MAP2K1 or Akt activation. A, C, E, G, I – Transmitted light images; lateral views, anterior to the left, dorsal is up. B, D, F, H, J-L – Epifluorescent images. A, B. Uninjected wild type embryo, showing no red fluorescence. C-H. Embryos injected with 150 pg of mRNA encoding mCher-actMAP2K1 showing defects increasing in severity from C. slight cyclopia and reduction in eye size, E. complete absence of eyes and reduction in forebrain, to G. complete loss of trunk and head structures. In each case, the mCheractMAP2K1 fusion could be visualized by red fluorescence (D, F, H). I-K. Embryo injected with 200 pg of mRNA encoding mAkt-2A-mCherry. I. At 27 hours post fertilization, injected embryos displayed slight pericardial edema and smaller eyes. J. Red fluorescence was also visible at 30 hpf. K. Tg(fli1:egfp)y1 embryos injected with mAkt-2A-mCherry mRNA also displayed enlarged caudal vein lumens (bracket) compared to L. uninjected Tg(fli1:egfp)y1 siblings. The presence of pericardial edema, small eyes, and expanded caudal vein suggests that early activation of Akt may lead to mild ventralization of the zebrafish embryo. |

Unillustrated author statements |
Reprinted from Developmental Biology, 329(2), Covassin, L.D., Siekmann, A.F., Kacergis, M.C., Laver, E., Moore, J.C., Villefranc, J.A., Weinstein, B.M., and Lawson, N.D., A genetic screen for vascular mutants in zebrafish reveals dynamic roles for Vegf/Plcg1 signaling during artery development, 212-226, Copyright (2009) with permission from Elsevier. Full text @ Dev. Biol.