- Title
-
Targeting retinal dopaminergic neurons in tyrosine hydroxylase-driven green fluorescent protein transgenic zebrafish
- Authors
- Meng, S., Ryu, S., Zhao, B., Zhang, D.Q., Driever, W., and McMahon, D.G.
- Source
|
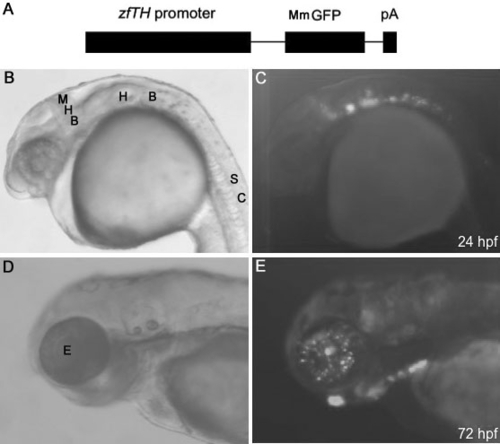
TH promoter-driven GFP expression during zebrafish development. A: Schematic map of the Tg(-12th:MmGFP) construct. The 12 kb sequence containing the zebrafish TH (zfTH) promoter was ligated with MmGFP followed by an SV40 polyadenylation tail (pA). B and C display the bright-field image, and fluorescence image of GFP expression in the embryonic neural system at 24 hpf, respectively. D and E illustrate the bright-field image of the embryonic zebrafish, and fluorescence image of GFP expression in the embryonic retina at 72 hpf, respectively. For B - E, dorsal is on the top and anterior is on the left. Abbreviations: Midbrain and hindbrain boundary (MHB); hindbrain (HB); spinal cord (SC); eye (E). EXPRESSION / LABELING:
|
|
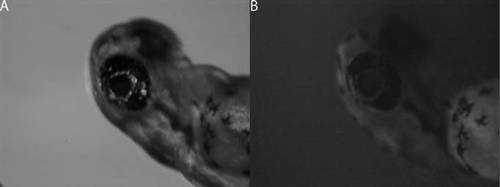
Lack of GFP expression in wild-type zebrafish. Panel A illustrates the bright-field image of embryonic zebrafish at 72 hpf. A fluorescence image from the same zebrafish shows no GFP expression in the retina. |
|
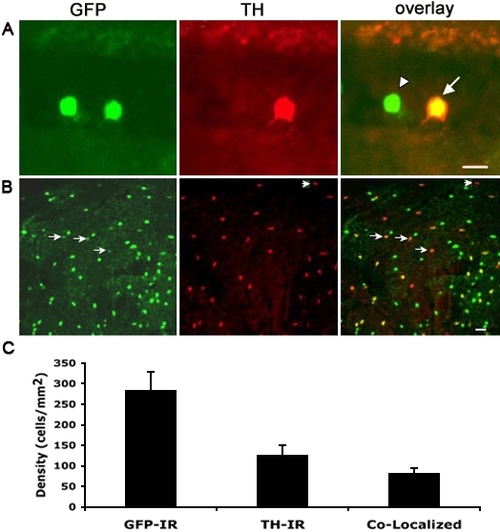
Double immunostaining using anti-GFP and anti-TH antibodies. Immunostaining experiments were performed in vertical retinal sections (A) and the whole-mount retina (B). GFP-IR, TH-IR, and GFP-IR/TH-IR are shown in green, red and yellow, respectively. Quantification of double-staining in the whole-mount retina is shown in C. Values represent the mean±SD from 4 individual retinas. The cell density was calculated by dividing the number of cells by the image area calculated by MetaMorph. Overall, 29±2% of GFP-labeled cells coexpressed TH. Scale bar equals 10 μm for A and 20 μm for B. Arrowhead in A points to a GFP-IR/non-TH-IR cell. Arrowhead in B points to a TH-IR/non-GFP-IR cell. EXPRESSION / LABELING:
|
|
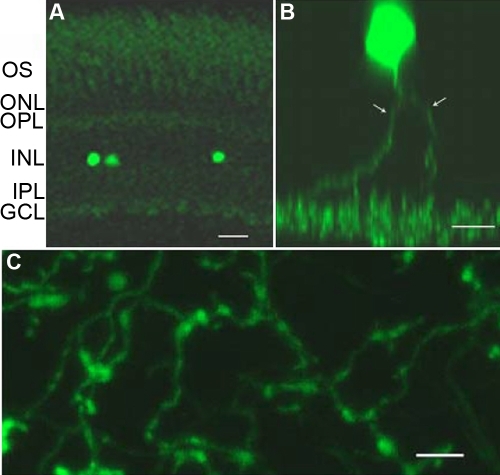
Morphology of GFP-expressing cells in the retina. A: Localization of GFP-positive cells can be seen in this vertical retinal section. Most of the GFP-expressing cells were found at the proximal cellular row of the inner nuclear layer. Abbreviations: ONL: outer nuclear layer (ONL); OPL: outer plexiform layer (OPL); INL: inner nuclear layer; IPL: inner plexiform layer. B: This z-stack image shows the somata and processes of a single cell. C, GFP fluorescent fiber network in the inner plexiform layer. Scale bar equals 20 μm for A and C, and 10 μm for B. EXPRESSION / LABELING:
|
|
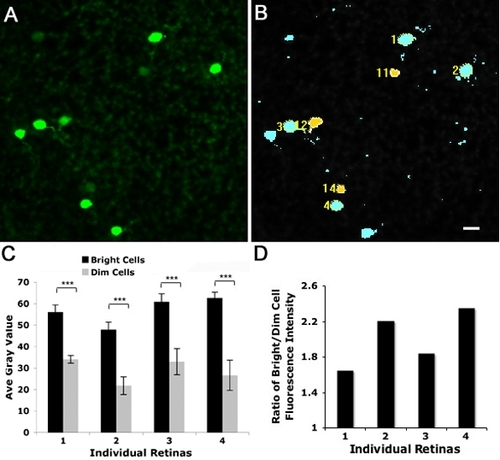
Quantification of fluorescence intensity among GFP-labeled cells. A: Representative GFP-immunostained cells shown in A were analyzed in MetaMorph (B). The scale bar represents 10 μm for A and B. Bright cells were color coded as blue (cells 1, 2, 3 and 4), and dim cells were yellow (cells 11, 12, and 14). C: Quantification of fluorescence intensity of bright and dim cells were analyzed in four individual retinas. For each retina, 10 bright cells and 10 dim cells were chosen using the same threshold. Value represents mean±SD (n=10 for each cell subpopulation). Triple asterisks (***) indicate p<0.001. D displays the ratio of bright cell fluorescence to dim cell fluorescence intensity. For all four retinas, bright cells were 2.0±0.3 (mean±SD) fold brighter than dim cells in fluorescence intensity. EXPRESSION / LABELING:
|
|
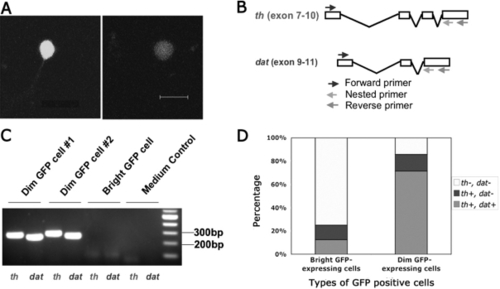
Analysis of two subpopulations of GFP-positive cells using single-cell RT–PCR. A: Representative bright and dim GFP-positive cells in dispersed retinal culture were imaged at the same excitation intensity. Scale bar equals 10 μm. B: Schematic diagram shows the primers used for seminested PCR. For th, the size of the 2nd round PCR product was 277 bp. For dat, the size was 250 bp. C: Representative gel image shows the 2nd round PCR product from dim GFP cells, bright GFP cells, and medium control sample. Primer sets used were indicated at the bottom. D: Expression frequency of th and dat genes is different between bright GFP expressing cells and dim GFP expressing cells as assayed by single-cell RT–PCR. For bright GFP-expressing cells, 8 cells were examined. For dim GFP-expressing cells, 7 cells were examined. EXPRESSION / LABELING:
|
|
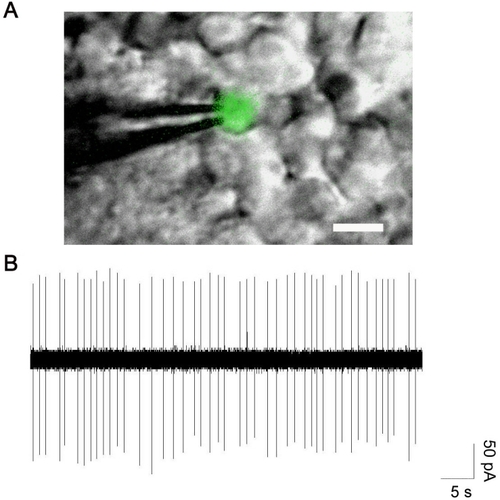
In isolated whole mount retina, GFP-labeled neurons exhibit spontaneous spikes. Merged fluorescence and infrared images of a Tg(-12th:MmGFP) neuron and recording electrode in a whole mount zebrafish retina is shown in panel A. Scale bar equals 10 μm. Panel B displays spontaneous spikes recorded in a GFP-labeled cell. Loose-patch recordings were made using a voltage-clamp mode with an electrode holding potential of 0 mV. |

