
- Title
-
Interaction with Notch determines endocytosis of specific Delta ligands in zebrafish neural tissue
- Authors
- Matsuda, M., and Chitnis, A.B.
- Source
- Full text @ Development
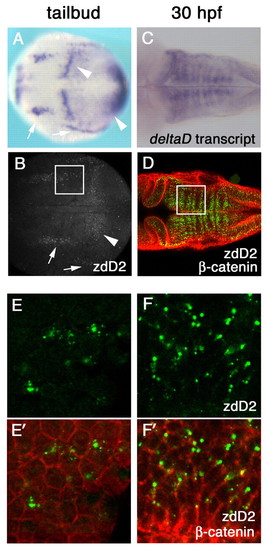
DeltaD protein is primarily localized in cytoplasmic puncta. (A-D) deltaD transcript distribution (A,C) and anti-DeltaD mAb zdD2 staining (B,D) are similar. (A,B) Arrows indicate neural expression and arrowheads indicate the mesodermal expression in tail bud stage zebrafish embryos. (C,D) DeltaD expression in the hindbrain at 30 hpf. zdD2 in green and β-catenin in red. (E-F′) Magnified images correspond to squares in B and D. (E,F) zdD2 staining. (E′,F′) Merged images with zdD2 (green) and β-catenin (red). DeltaD protein is mainly detected as cytoplasmic puncta and does not colocalize with β-catenin. |
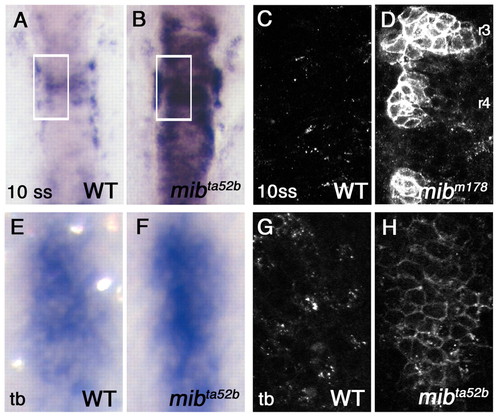
Accumulation of DeltaD protein on the plasma membrane in the mib mutant. (A,B) Hindbrain expression of deltaD transcript in wild-type (WT) and mibta52b 10-somite stage (10 ss) zebrafish embryos. (C,D) DeltaD protein in areas corresponding to the rectangles in A and B. Embryos are stained with zdD2. The patches of DeltaD expression in D are in rhombomeres 3, 4 and 5. (E,F) deltaD transcript in wild type and mibta52b at the tail bud stage (tb) in hindbrain neurogenic domains. Area shown here corresponds approximately to rectangular areas in Fig. S1A,B (see supplementary material). mibta52b embryos do not have significantly exaggerated deltaD expression. (G,H) zdD2 staining in corresponding wild-type and mibta52b neurogenic domains. In mibta52b mutants, most DeltaD is at the cell surface, even when expression is not so exaggerated. EXPRESSION / LABELING:
|
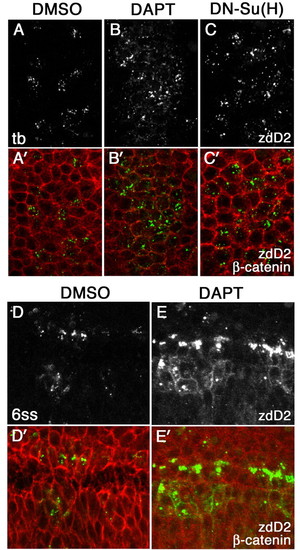
The effect of loss of Notch signaling on surface accumulation of DeltaD. DeltaD distribution in DMSO-treated (A,A′), DAPT-treated (B,B′) or DN-Su(H)-expressing zebrafish embryos (C,C′) at the tail bud stage, and in DMSO-treated (D,D′) and DAPT-treated (E,E′)embryos at the six-somite stage (6 ss). Areas shown in A-C′ correspond approximately to rectangular areas in Fig. S1E,F (see supplementary material). Embryos were stained with zdD2 (A-E) and double-stained (A′-E′) with β-catenin (zdD2 in green, β-catenin in red). DAPT and DN-Su(H) treatment increased the numbers of cells expressing DeltaD but did not result in DeltaD accumulation at the cell surface at the tail bud stage. Some cell surface DeltaD is detected in DAPT-treated embryos by the six-somite stage; however, it is accompanied by intense cytoplasmic puncta. EXPRESSION / LABELING:
|
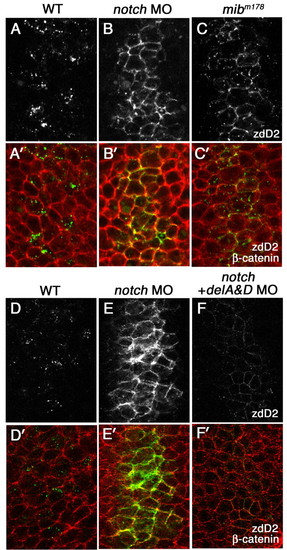
The effect of loss of Notch receptors on surface accumulation of DeltaD. (A-C′) A comparison of DeltaD distribution in wild type, notch1a and notch3 morphants, and mibm178 mutant zebrafish embryos at the tail bud stage. Areas shown here approximately correspond to rectangular areas in Fig. S1A-D (see supplementary material). Embryos are double-stained with zdD2 (grey in A-C, green in A′-C′) and β-catenin (red in A′-C′). DeltaD-expressing cells are increased and DeltaD is mainly localized at cell surface in both Notch morphants (B,B′) and mibm178 mutants (C,C′). (D-F′) DeltaD distribution in Notch morphants with (F,F′) or without (E,E′) co-injection of deltaA and deltaD (deltaA&D) MOs. Though co-injection of deltaA&D MO dramatically reduces zdD2 staining (compare E with F), DeltaD is still localized at the cell surface. EXPRESSION / LABELING:
|
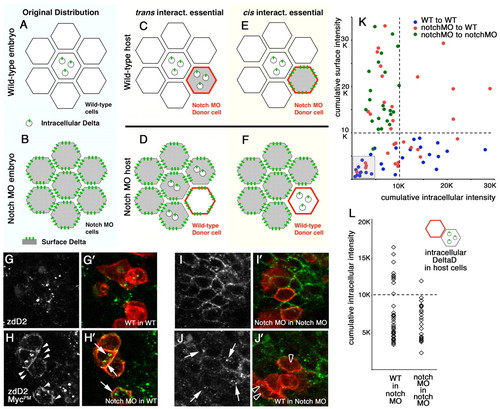
Delta-Notch interactions in trans and cis contribute to DeltaD endocytosis in zebrafish. (A-F) Schematic of changes in DeltaD distribution expected following transplantation if endocytosis was determined primarily by interactions in trans (C,D) or in cis (E,F). If Notch interactions in `trans' were essential for Delta endocytosis: (C) DeltaD would be in cytoplasmic puncta in Notch MO donor cells in a WT host, (D) DeltaD would accumulate on the cell surface of WT donor cells in Notch MO host, and some Delta would now also be internalized in host Notch MO cells following interaction with Notch in adjacent WT donor cells. If `cis' interactions with Notch were essential for Delta endocytosis: (E) DeltaD would remain on the surface of donor Notch MO cells in a WT host and (F) DeltaD would remain in cytoplasmic puncta in a donor WT cell in Notch MO hosts. (G-J′) Transplantation results. (G,G′) In WT to WT transplants, DeltaD remains in intracellular puncta in WT donor and host cells. (H,H′) In Notch MO to WT transplants, some DeltaD in Notch MO donor cells becomes localized in cytoplasmic puncta (arrows in H′), suggesting that interactions with in trans promote endocytosis. However, some DeltaD remains on the cell surface (arrowheads in H) in Notch MO donor cells, suggesting an additional requirement for interactions in cis. (I,I′) In Notch MO to Notch MO transplants, DeltaD remains on the cell surface in Notch MO donor cells in Notch MO hosts. (J,J′) In WT to Notch MO transplants, some adjacent Notch MO host cells now show DeltaD in cytoplasmic puncta (arrows in J), suggesting DeltaD endocytosis following interactions in trans. Observation of cytoplasmic DeltaD puncta in WT donor cells in Notch MO hosts (black arrowheads in J′) suggest Notch interactions in cis contribute to DeltaD endocytosis. (K,L) Quantitative analysis. Cumulative pixel intensity within the cell or at the cell surface, representing the fluorescence of a secondary antibody recognizing zdD2, was measured in individual cells to quantify the distribution of DeltaD protein. Each spot represents an individual cell. (K) Scatter plot of relative intracellular (x-axis) versus cell surface (y-axis) distribution in transplanted cells from WT to WT (blue), Notch MO to Notch MO (green) and Notch MO to WT (red). The broken line indicates 10 K units and the area below 5 K units is shadowed. (L) Cumulative intracellular intensity in Notch MO host cells adjacent to WT transplants and Notch MO host adjacent to Notch MO transplants. |
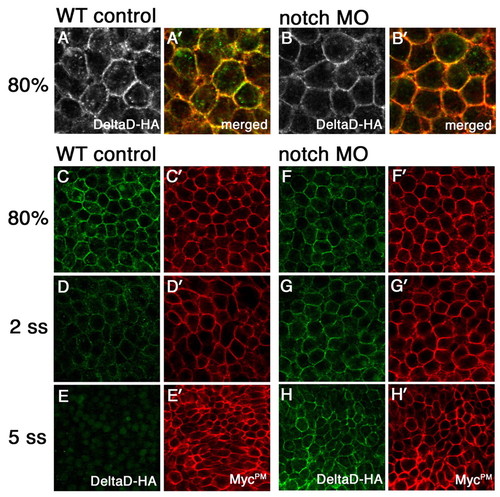
Notch-mediated DeltaD endocytosis results in DeltaD degradation. (A-B′) Distribution of DeltaD-HA in WT and Notch MO zebrafish embryos. In vitro synthesized mRNA encoding DeltaD-HA and MycPM was co-injected with control (WT in A,A′) or notch1a and notch3 MOs (Notch MO in B,B′). Embryos are labeled with anti-HA mAb (green) and anti-myc pAb (red) at 80% epiboly stage. More DeltaD-HA is localized in cytoplasmic puncta in WT than in Notch MO cells. (C-H′) Comparison of DeltaD-HA (green) and MycPM stability with (F-H) and without Notch morpholinos (C-E). DeltaD-HA expression reduces from 80% epiboly (C) to the two-somite stage (2 ss) (D) and is barely detectable at the five-somite stage (5 ss) (E) in WT. By comparison, MycPM expression levels are progressively increased from 80% epiboly to 5 ss (C′-E′). In Notch MO embryos, Delta-HA (F-H) behaves like MycPM (F′-H′) and its expression is not decreased. |
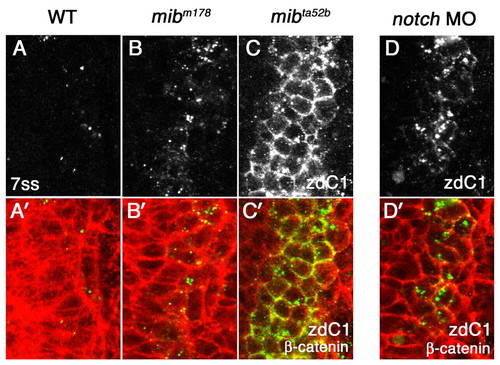
Mib1, Notch1a and Notch3 are not essential for DeltaC endocytosis. (A-C′) Distribution of DeltaC in wild-type zebrafish embryos (A,A′) and in two mib alleles, mibm178 (B,B′) and mibta5ab (C,C′). (D,D′) Distribution of DeltaC in Notch MO embryos. Eight-somite stage embryos were double stained with zebrafish DeltaC antibody zdC1 (grey in A-D, green in A′-D′) and β-catenin (red in A′-D′). A dorsal view of a lateral neurogenic domain in the caudal neural plate is shown. In WT embryos, only subset of cells express DeltaC in cytoplasmic puncta (A,A′). A neurogenic phenotype allows more cells to express DeltaC in both mib mutants and Notch MO embryos as Notch signaling is reduced (B-D). However, DeltaC distribution remains cytoplasmic in mibm178 (B,B′) and Notch MO embryos (D,D′), and it only accumulates on the cell surface in mibta52b mutant embryos (C,C′). EXPRESSION / LABELING:
|
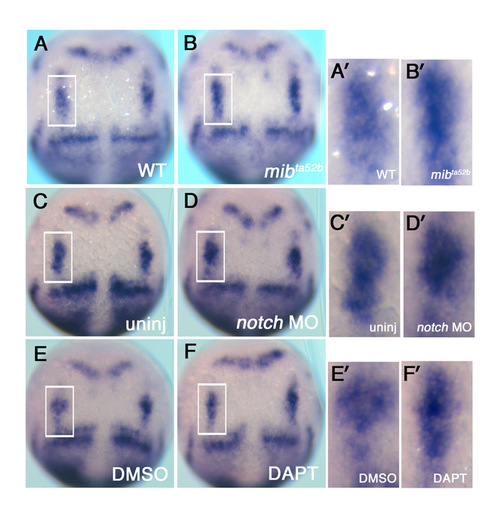
Comparison of the expression of deltaD transcript following loss of Notch signalling. (A-F′) A comparison of deltaD transcripts in wild-type sibling zebrafish embryos (A,A′) with that in mib mutants (B,B′), in un-injected embryos (C,C′) with Notch MO morphants (D,D′), and in DMSO-treated controls (E,E′) with DAPT treated embryos (F,F′) at the tail bud stage. Accompanying panels on the right (A′-F′) are magnified images of neurogenic domains in hindbrain delineated with rectangles in A-F. deltaD transcripts were not significantly increased at the tail bud stage following reduced Notch signaling. |
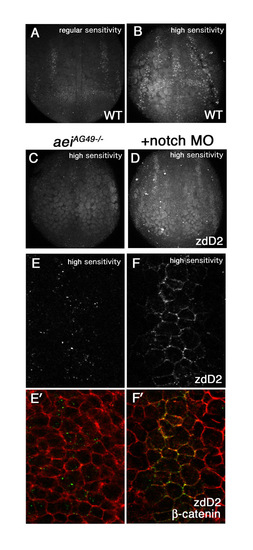
Notch interaction regulates DeltaA endocytosis. (A,B) Comparison of zdD2 detection with a fluorescent secondary with standard gain used for most cases in this study (A), and with higher gain (B). (C-F′) zdD2 distribution visualized using higher gain in aeiAG49 homozygous embryos (C,E,E′) and in aeiAG49 homozygous embryos co-injected with notch1a and notch3 (D,F,F′). There remains faint zdD2 staining in aeiAG49 homozygous embryos (C), which is easier to see when notch1a and notch3 are knocked down (D). (E-F′) aeiAG49 homozygous embryo with (F,F′) or without (E,E′) notch morpholinos are double stained with zdD2 (grey in E,F, green in E′,F′) and plasma membrane marker β-catenin (red in E′,F′). Magnified images of two longitudinal neurogenic domains in the prospective hindbrain. The setting with high gain was used to take these images. With standard gain there is almost no signal detected in aeiAG49 homozygous embryos. DeltaA remains at the plasma membrane in Notch MO (F,F′). |