
- Title
-
The role of the ETS factor erg in zebrafish vasculogenesis
- Authors
- Ellett, F., Kile, B.T., and Lieschke, G.J.
- Source
- Full text @ Mech. Dev.

erg expression during early zebrafish development. (A) Earliest expression of erg in lateral plate mesoderm at approximately 12 hpf (dorsal view, full arrowhead). (B) Flat-mount preparation shows overlap of early erg expression (blue) with tal1 expression (red) in vascular (filled arrowheads) but not haematopoietic progenitors (empty arrowhead). (C) Lateral view of tail displaying ICM expression of erg in developing vascular structures (blue, full arrowheads) partially overlapping that of the embryonic globin hbbe3 (red, empty arrowheads) as the developing caudal vein coalesces around erythroid cells prior to circulation. (D) Transverse section showing erg expression in bifurcated cental arterial (filled arrowheads) and lateral venous structures (empty arrowheads). (E) erg expression at 30 hpf in all developing vascular structures in the brain, trunk and tail of the embryos (full arrowheads). (F) Later erg expression restricted to vasculogenesis in the brain, aortic arches and developing fin bud (full arrowheads). (G) erg expression remains detectable in the aortic arches at 96 hpf (full arrowhead). (H–J) erg expression is absent in the cloche (clo) mutant during angioblast specification and during vasculogenesis (empty arrowheads indicate sites of loss of erg expression). (clo genotype recognised from the expected Mendelian ratio). All panels containing whole-mount in situ hybridisation analyses; unless otherwise stated, anterior is to the left, and, except in flat-mounts, dorsal is to the top. (K) Semi-quantitative RT-PCR showing erg expression over the time period described (25, 30 and 35 cycles shown). β-actin (bact) expression was used as a positive control for each timepoint and to show linear amplification (20 and 25 cycles shown). Each primer pair was designed to span an intron, providing a genomic DNA-contamination internal negative-control. For more details, see Section 4. EXPRESSION / LABELING:
|
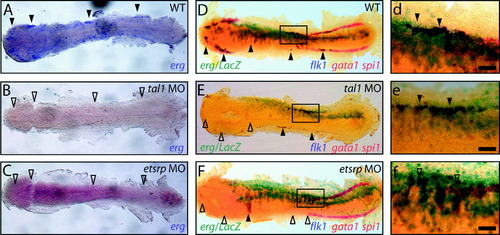
erg overexpression drives mesodermal angioblast proliferation / specification. (A) Mesodermal erg expression defines angioblast populations at 14 hpf (full arrowheads) and is lost in etsrp (n = 20/20) and tal1 morphants (n = 20/20) (B and C, respectively, empty arrowheads). (D–F/d–f) Triple in situ at 14 hpf shows spi1 and gata1 marking anterior myeloid and posterior erythroid progenitors, respectively, in red and flk1 marking angioblast populations in blue. Lateral erg overexpression is traced with LacZ mRNA in turquoise. (D/d, E/e) erg overexpression specifically expands existing flk1-expressing lateral angioblast populations present in WT (5/5) and tal1 morphant (n = 10/10) embryos (full arrowheads) but is unable to rescue absent flk1-expressing lateral angioblast populations in etsrp morphant (n = 5/5) embryos (F/f, empty arrowheads). Panels d, e and f are details of boxed areas in D, E and F, respectively. All panels are whole-mount in situ hybridisation analyses, flat-mounted, with anterior to the left Scale bars: 50 μm. EXPRESSION / LABELING:
|

erg acts synergistically with etsrp to regulate vascular development. (A) Panels show GFP-marked vasculature in wild-type and ergMO, etsrpMO and double morphants on the Tg(fli1:EGFP) line at 48 hpf. erg knock-down with an antisense morpholino oligonucleotide had no effect on vascular development unless introduced on a sensitised etsrp morphant background. Note the slight disruption of intersegmental vessel sprouting from the dorsal aorta to form the dorsal longitudinal anastomotic vessels in etsrpMO morphants, and the much more severe disruption in ergMO and etsrpMO double morphants (full arrowheads). (B) Vascular development was quantified by counting intersegmental vessels that fully connected the dorsal aorta to dorsal longitudinal anastomotic vessels in embryos at 48 hpf. Collated data show significant reduction of intersegmental sprouting in ergMO + etsrpMO versus ergMO morphants. Collectively the morphological and quantitative data indicate a synergistic but redundant role for erg in vascular development. Error bars are standard errors (uninjected, morphant groups; n = 3 experiments) and standard deviation (control MO, n = 23 embryos from one experiment). Numbers within bars indicate collated number of embryos scored for each group. PHENOTYPE:
|
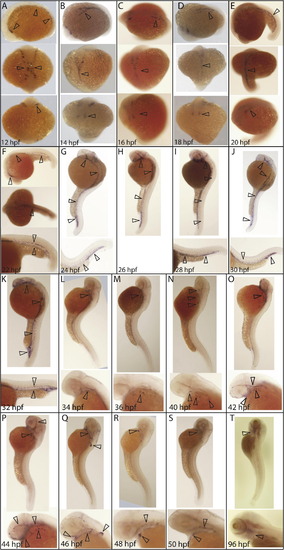
Detailed time-course of erg expression during vasculogenesis. (A) erg expression was first observed at 12 hpf in mesodermal angioblasts. Later, erg positive cells are located in the midline and begin to coalesce into major axial and cranial vessels (B–E). (F) By 22 hpf, erg positive cells distinctly define the anterior lateral dorsal aortas, mandibular arches and ventral aorta; lateral dorsal aorta and posterior cardinal vein and posterior caudal artery and caudal vein. (G–J) Between 24 and 30 hpf, erg expression also expands to cranial primitive internal carotid artery, primordial midbrain channel, middle cerebral vein, anterior cerebral vein, and caudal and cranial divisions of the internal carotid artery. At 32 hpf (K), erg expression is retained in developing cranial, lateral and posterior vessels while faint expression is observed in developing intersegmental vessels. At 34 hpf (L), erg expression is lost in all major vessels, with expression then restricted to vessels in the developing pharyngeal arch region until 42 hpf (N). At 42 hpf (O), some expression is also seen in developing cranial vessels, although this is mostly lost by 46 hpf (Q), at which point expression is most prominent in the developing fin bud. By 50 hpf (S), expression is restricted to the primary head sinus, hepatic portal/common cardinal venous plexus, primitive internal carotid artery and mandibular arches. erg expression is still detectable in the aortic arches at 96 hpf (T). All panels are whole-mount in situ hybridisation analyses. Orientations are as follows. (A–E) Top panel: lateral; central panel dorsal; lower panel ventral. (F) Top panel: lateral; central panel dorsal; lower panel tail at higher magnification. (G–K) Top panel lateral, lower panel tail at higher magnification. (L–T) Top panel: lateral view, lower panel: head at higher magnification. EXPRESSION / LABELING:
|
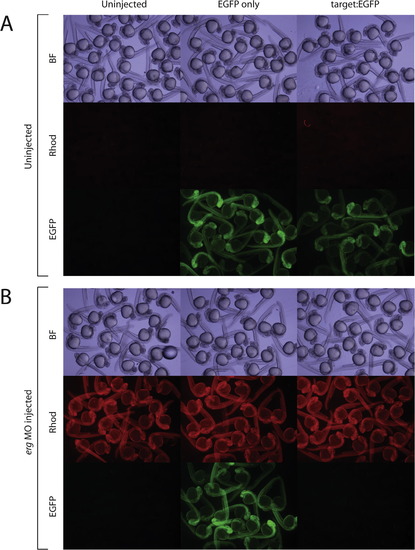
Reporter assay validating the functional binding of ergMO to its target sequence. (A) Shows EGFP fluorescence in EGFP-only (control) and Target:EGFP (test) groups in the absence of erg ATG-targeting morpholino. (B) erg ATG-targeting morpholino efficiently knocks down EGFP expression in Target:EGFP but not EGFP-only injected embryos. Uninjected controls are shown for each experiment and wavelength. Rhodamine dextran dye was used a tracer for morpholino injection. Panels show pools of randomly selected embryos. Methodological details are in text. Top panels: bright field (BF); central panels: Rhodamine fluorescence; lower panels: EGFP fluorescence. Bright-field and fluorescent images were taken with 8 ms and 8 s exposure times, respectively. |

erg overexpression expands vascular precursors at the expense of other haemangioblast-derived lineages. In situ hybridisation gene expression analysis in the presence/absence of erg overexpression at 12 hpf, comparing vascular, myeloid and haematopoietic precursors (as marked by flk1, spi1 and gata1 expression, respectively). erg overexpression consistently leads to expansion of vascular precursors at the expense of myeloid and haematopoietic lineages, suggesting that erg is acting to bias specification of haemangioblasts towards a vascular fate. (x/y) indicates the number of embryos displaying the phenotype shown (x) and the total number of embryos in the treatment group (y). |
Reprinted from Mechanisms of Development, 126(3-4), Ellett, F., Kile, B.T., and Lieschke, G.J., The role of the ETS factor erg in zebrafish vasculogenesis, 220-229, Copyright (2009) with permission from Elsevier. Full text @ Mech. Dev.