
- Title
-
The roles of the FGF signal in zebrafish embryos analyzed using constitutive activation and dominant-negative suppression of different FGF receptors
- Authors
- Ota, S., Tonou-Fujimori, N., and Yamasu, K.
- Source
- Full text @ Mech. Dev.

Effects of ca-FGFRs on early development of zebrafish embryos. Alive views (A–F and Y-d) or marker expression patterns (G–X and e–j) of embryos, which were injected with mRNA for ca-FGFRs that are specified at the top (50 pg/embryo except for ca-R3, for which 5 pg mRNA/embryo was used), are shown at the bud stage (A–X) or 24 hpf (Y-j). (G–L) Expression of ntl in the notochord. (M–R and e–j) The expression of six3b, pax2a, and krox20 in the forebrain (asterisk), MHB (triangle), and hindbrain (r3, r5), respectively. (S–X) The expression of spry4 as a readout of the FGF signal. When the expression was considered abnormal compared with control embryos injected with egfp mRNA, the numbers of abnormal embryos and those of stained embryos are shown at the bottom right. (A–F, J, and M-d) Lateral views with dorsal to the right (A–F, J, and M–X) or to the top (Y-d). (G–I, K, L, and e–j) Dorsal views with anterior to the top (G–I, K, and L) or to the left (e–j). Scale bars, 100 μm. |
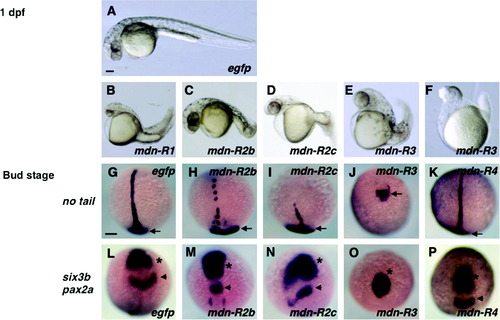
Zebrafish embryos overexpressing different mdn-FGFRs. Embryos were injected with mRNA (300 pg/embryo) for egfp (A, G, and L) or mdn-FGFRs (B–F, H–K, and M–P). (A–F) Lateral views of 26-hpf embryos with anterior to the left and dorsal to the top. (G–I, K–N, and P) Dorsal views of bud-stage embryos with anterior to the top. (J and O) Vegetal view (J) or animal view (O) of bud-stage embryos with dorsal to the top (J) or bottom (O), respectively. Embryos were stained for the expression of ntl in the notochord (G–K) or six3b and pax2a in the forebrain (asterisk) and MHB (triangle), respectively (L–P). Scale bars, 100 μm. |

Dose-dependent effects of mdn-R3 on the anterior–posterior patterning of the embryo. (A–D) Embryos were injected with egfp mRNA (500 pg/embryo, (A)) or different doses of mdn-R3 mRNA (160–640 pg/embryo) and stained at the bud stage for six3b in the forebrain (asterisk) and pax2a in the MHB (triangle)/otic vesicle (OV)/pronephros. In the views shown here, pax2a expression in the pronephros cannot be seen. (E) Progressive disruption of the embryonic anterior–posterior pattern with increasing doses of mdn-R3 mRNA. Red, only six3b expression in the forebrain was observed; green, the expression of six3b in the forebrain and that of pax2a in the MHB were observed; white, the expression of six3b in the forebrain and that of pax2a in the MHB and OV were observed; blue, the expression of six3b in the forebrain and pax2a in the MHB/OV/pronephros normally occurred. Scale bars, 100 μm. |
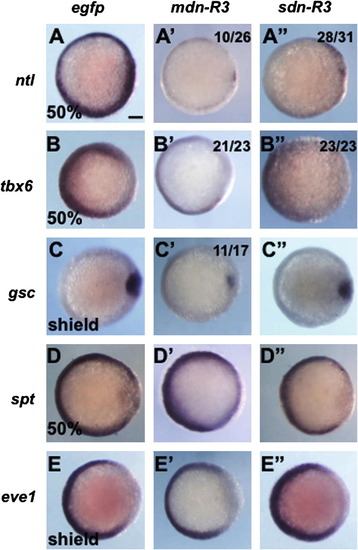
Effects of two types of dominant-negative FGFR3c on the patterning in early gastrulae. Embryos were injected with mRNA (300 pg/embryo) for egfp, mdn-R3, or sdn-R3, and examined for the expression of regional marker genes at 50% epiboly or shield stage. All are animal pole views with dorsal to the right. When the injected embryos showed anomalies compared to control, the numbers of abnormal embryos against those that were stained are shown at the right top. The expression of ntl and tbx6 in the blastoderm margin was downregulated by both dominant-negative genes. gsc expression was repressed only with mdn-R3, and the expression of spt and eve1 in the ventral margin was little affected. Scale bars, 100 μm. |
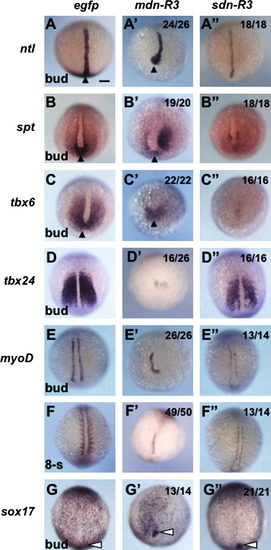
Effects of two types of dominant-negative FGFR3c on the mesoderm and endoderm formation at the end of gastrulation. Embryos were injected with mRNA (300 pg/embryo) for egfp, mdn-R3, or sdn-R3, and examined for the expression of mesodermal and endodermal marker genes at the bud stage except for (F–F″), in which expression was examined at the 8-somite stage. Marker expression in the tailbud and forerunner cells are marked with solid and open triangles, respectively. Dorsal views (A, D–G, F′, A″, and D″–G″) or dorsovegetal views (B, C, A′–E′, G′, B″, and C″) with anterior to the top. Rates of embryos with anomalies are shown at the right top. Scale bars, 100 μm. |
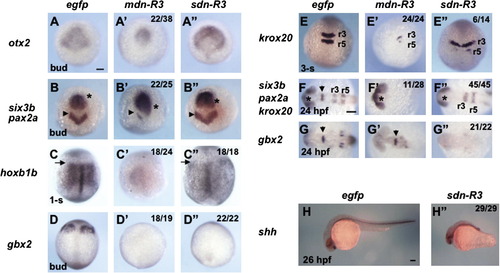
Effects of two types of dominant-negative FGFR3c overexpression on the neural plate regionalization. Embryos were injected with mRNA (300 pg/embryo) for egfp, mdn-R3, or sdn-R3, and examined for the expression of regional marker genes in the neural plate at the bud/ 1-somite stage (A–D, A′–D′, and A″–D″), 3-somite stage (E, E′, and E″), or 24–26 hpf (F–H, F′, G′, and F″–H″). The positions of the forebrain, MHB, and the anterior boundary of r4 are marked with asterisks, triangles, and arrows, respectively. (A–G, A′–G′, and A″–G″) Dorsal views with anterior to the top (A–E, A′–E′, and A″–E″) or to the left (F, G, F′, G′, F″, and G″). (H and H″) Lateral views with anterior to the left and dorsal to the top. Rates of embryos with anomalies are shown at the right top. Scale bars, 100 μm. |

Effects of sdn-R3 overexpression on zebrafish embryos. (A–C, A′–C′, and C″) Bright-field views of embryos injected with mRNA for egfp (A–C, 300 pg/embryo) or sdn-R3 mRNA (C′), 100 pg/embryo; A′, B′, and C″, 300 pg/embryo). (A and A′) Animal–vegetal axes are shown with vertical lines. (D–G and D′–G′) Epifluorescence views of embryos injected with mRNA for egfp (D–G) or sdn-R3 (D′–G′) (300 pg/embryo). Normal isthmic constrictions, absence of the isthmus, otic vesicles, and accumulation of apoptotic cells are marked with sold triangles, open triangles, thick arrows, and thin arrows, respectively. Lateral views with anterior to the top and dorsal to the right (A and A′) or with anterior to the left and dorsal to the top (all the other panels) are shown. Scale bars, 100 μm. |

Specific suppression of the Fgf8 subfamily growth factors by sdn-R3 overexpression. Zebrafish embryos were co-injected with mRNA (250 pg/embryo) for egfp (A–E) or sdn-R3 (A′–D′ and E) together with different fgf mRNA (fgf3, fgf4, fgf8, fgf8.2, fgf16, fgf17b, fgf24) at minimal amounts sufficient to attain complete dorsalization. The effect of fgf overexpression (elongation) was examined to evaluate the suppressive effects of sdn-R3. (A–D and A′–D′) Typical results for the suppressive effects of sdn-R3 on the dorsalizing activities of fgf3, fgf4, and fgf8 are shown. The dorsalizing activity of fgf3 and fgf4, as revealed by the elongated morphology, was not affected by sdn-R3, whereas the effects of fgf8 were strongly suppressed. It should be noted that embryos co-injected with mRNA for fgf8 and sdn-R3 were no more simply elongated, but that they were distorted as shown in Fig. 8A′, which is the reason why embryos also seem slightly elongated. Importantly, the FGF signal was disrupted in these apparently elongated embryos as visualized by the downregulation of spry4 (Supplementary Fig. 2K and N, additional data not shown). Scale bars, 1 mm. (E) Embryos were judged as rescued as described in the legend to Fig. 4 and Supplementary Fig. 3B. The ordinates represent the percentages of embryos which were judged dorsalized. Co-injection was repeated three times for each combination, and the error bars show standard errors of means. The amounts of sdn-R3 and egfp mRNA are shown at the bottom of each panel. |

Effects of ca-FGFRs at the blastula stage and later stages. (A–E) Dome-stage embryos injected with ca-FGFR mRNA. (F–H) Frontal views of embryos injected with egfp or ca-R mRNA (dorsal to the top), which were stained at the bud stage for six3b, pax2a, and krox20. Scale bar, 100 μm. |
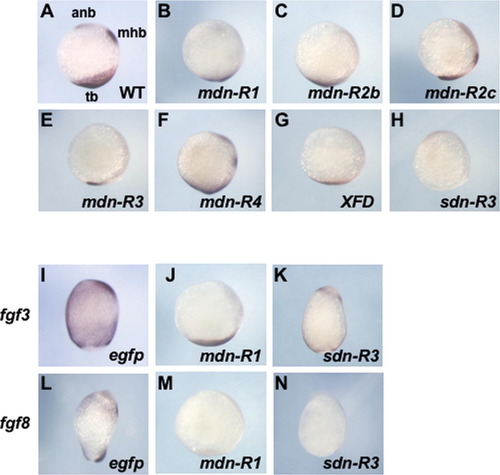
Evaluation of the FGF signal in embryos injected with mRNA for dominant-negative FGFRs and/or fgf genes. (A–H) The endogenous expression of spry4 in the anterior neural boundary (amb), MHB, and tailbud (tb) (A) was downregulated by overexpression of mdn-R genes (B–F), XFD (G), and sdn-R3 (H) at the bud stage. (I–N) Ectopic expression of spry4 induced by fgf3 and fgf8 was suppressed efficiently by mdn-R1, whereas sdn-R3 abrogated the effects of fgf8, but not of fgf3. The apparent reduction of spry4 expression in the embryo co-expressing fgf3 and sdn-R3 is probably due to the suppression of endogenous FGF8 subfamily genes. Lateral views with anterior to the top and dorsal to the right. |
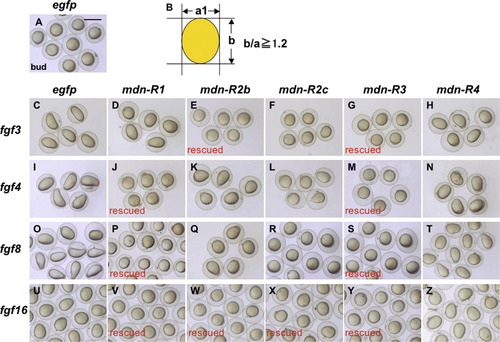
Embryos co-injected with mRNA for mdn-R and fgf genes. Zebrafish embryos were co-injected with mRNA (300–400 pg/embryo) for egfp or specified mdn-R genes together with different fgf mRNA at minimal amounts sufficient to attain complete dorsalization. All the fgf genes caused dorsalization, as revealed by elongation along the animal-vegetal axis at the bud stage (compare C, I, O, U with A), which was suppressed selectively by some of the mdn-R genes. The criterion of rescue was whether the ratio of the animal-vegetal axis (b) to the other axis (a) was reduced below 1.2 (B). ‘Rescue’ shows nearly complete rescue of embryos by mdn-R overexpression. |
Reprinted from Mechanisms of Development, 126(1-2), Ota, S., Tonou-Fujimori, N., and Yamasu, K., The roles of the FGF signal in zebrafish embryos analyzed using constitutive activation and dominant-negative suppression of different FGF receptors, 1-17, Copyright (2009) with permission from Elsevier. Full text @ Mech. Dev.