FIGURE SUMMARY
Title

In vivo Analysis of Choroid Plexus Morphogenesis in Zebrafish

Authors
García-Lecea, M., Kondrychyn, I., Fong, S.H., Ye, Z.R., and Korzh, V.
Source
Full text @ PLoS One

Formation of the fourth ventricle choroid plexus in Gateways zebrafish transgenics.
A, at 24hpf GFP expression was absent at the roof of fourth ventricle; B, at 36hpf GFP-positive cells are present at the dorsal midline of the roof of fourth ventricle; C, the number of GFP-positive cells increased, they are separated from the roof plate posteriorly; D, ChP has formed at the dorsal midline at the ear level; E, F, ChP tightens. G, H, lateral and dorsal view of gfp expression pattern in transgenics. Compare that to i showing expression of zgc:66340 in dorsal view. A–F, dorsal view. Abbreviations: dChP – diencephalic ChP; ChP – choroid plexus of hindbrain, hb – hindbrain, mhb – midbrain-hindbrain boundary, r5 – rhombomere 5, rp – roof plate, tc – tela choroidea. In all figures scale bars = 50 μm unless otherwise indicated.

Comparative histological and developmental analysis of the fourth ventricle choroid plexus in Gateways zebrafish transgenics.
A–C – 72hpf, D–F – 144hpf. A, A′, D, D′, - dorsal view, B, B′, B″, C, C′, E, E′, E″, F, F′ – cross sections. All A, B, D, E images show GFP expression, all C and F bright field images show staining with hematoxylin-eosin; B″ and E″ are composite fluorescence-bright-field images. Abbreviations: ChP – choroid plexus, 4thV – fourth ventricle, r5 – rhombomere 5, starlet in F′ – skin epithelium, arrowheads in F′ – vessel.

Lineage analysis of ChP.
Transplantation was performed at 6hpf and the outcome was visualized at 48hpf (n = 5) and 60hpf (n = 4). A–C, schematic of the transplantation experiment. A,B, drawing of the animal view of 6hpf embryos. C, drawing of the lateral view of a 6hpf embryo. A, Texas Red-injected Gateways donor. B,C, wild type host. D–G, lateral view of 48hpf host embryo. D, Texas Red-labelled descendants of transplanted cells. E, GFP positive descendants of transplanted cells. F, merged D&E. G, merged F & bright field image. H,I, dorsal view of 60hpf host embryo. H, cluster of GFP-positive cells in the roof of fourth ventricle. I, merged H & bright field image. Abbreviations: ba – branchial arch, hb – hindbrain, mhb - midbrain-hindbrain boundary.

Comparative analysis of formation of the fourth ventricle ChP and vasculogenesis.
Staining of Gateways by Bodipy (red) allows the in vivo analysis of ChP and cranial vasculature development. Extension of the DLV, growth of PCeV and closure of CCV occur at the same time as the transformation of the tela choroidea into ChP. A–C, confocal images at three different time points with their respective explicative drawings (A′, B′, C′, C″). D, E - dorsal optical section focused on ChP; D1 and E1 saggital optical sections at the level of the green line in D, E; D2, D3, E2, E3 cross optical sections at the level of the red lines in D, E. At all times ChP keeps a close contact with the developing vessels. Abbreviations: ChP – choroid plexus, CVC – choroidal vascular circuit, dlv- dorsal longitudinal vein, mv- midbrain vein, PCeV- posterior cerebral vein, rp- roof plate. Scale bar in D, D1–D3, E, E1–E3, 20 μm.

Mutant analysis of the formation of the fourth ventricle ChP.
A, D, G – control; B, E, H, - mibtfi91; C, F, I - smu694b. A–C – 36hpf, D–F – 48hpf, G-I – 66hpf. Images are confocal z-projections extracted from the movies. All images are taken in dorsal view with the anterior part of the embryo towards the right-bottom corner. In controls and mib mutants dividing cells were detected and none of cells were fragmented. In smu a number of fragmenting cells were detected (purple arrow, movies) with no cells dividing. Abbreviations: cb – cerebellum, mb – midbrain, rp- roof plate.

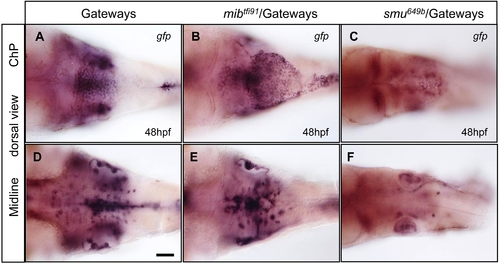
ChP and GFP-positive neurons at the ventral midline are affected in mutant transgenics as detected by anti-gfp WISH.
A, D – control, B, E - mibtfi91, C, F - smu694b. A–C – ChP, D–F – ventral midline. All images show gfp mRNA expression and are in dorsal view, anterior to the left.

Characterization of the Gateways Tol2 insertion site. (A) 600-kb locus of Chr. 24 (Zv7, release 49). Triangles represent ET insertions, where green triangles show insertions with GFP expression in ChP. (B) zgc:66340 locus. TSS at 12251781 bp was determined using 5′-RACE. The coding exons are depicted as black boxes, untranslated regions are represented as open boxes. The ET insertions are shown according to their position in zgc:66340 locus, green arrow shows EGFP gene in the ET construct (direction of the reporter gene transcription corresponds to the direction of arrow), gray box is a minimal promoter, dotted arrows represent 5′- and 3′-ends of Tol2 transposon). ET, enhancer trap; TSS, transcription start site; EGFP, enhanced GFP. (C,D, C′,D′) Dorsal and lateral views of GW42A and Gateways lines with insertions located in promoter region at different distances from TSS exhibit GFP expression in ChP. GW45C line with insertion located in intron has a weak GFP expression in ChP (not shown), while another intron-based insertion GW42B shows background GFP expression in skin (not shown). Abbreviations: ba - branchial arch, dChP - diencephalic ChP; ChP - choroid plexus of hindbrain, r5 - rhombomere 5, rp - roof plate.

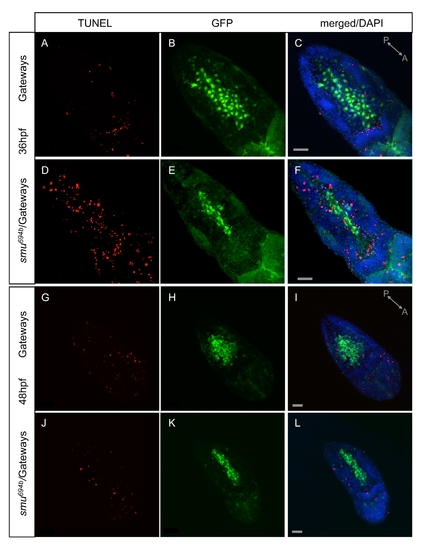
Apoptosis increased in smu mutant as detected by TUNEL. Two developmental stages were analyzed: 36hpf (A–C Gateways, D–F smu694b/Gateways) and 48hfp (G–I Gateways, J–L smu694b/Gateways). A,D,G,J - TUNEL; B,E,H,K - anti-GFP antibody staining; C,F,I,L - merged images of TUNEL/GFP and DAPI staining. All images are in dorsal view with anterior towards the right bottom corner.

EXPRESSION / LABELING:
Gene:
Fish:
Anatomical Term:
Stage Range: Prim-25 to Long-pec
PHENOTYPE:
Fish:
Observed In:
Stage Range: Prim-25 to Long-pec

Cell proliferation in the dorsal hindbrain as detected by anti-pH3 antibody. Two developmental stages were analyzed: 36hpf (A–C Gateways, D–F smu694b/Gateways) and 48hfp (G–I Gateways, J–L smu694b/Gateways). A,D,G,J - anti-pH3 antibody staining; B,E,H,K - anti-GFP antibody staining; C,F,I,L - merged images of anti-pH3/GFP staining and DAPI staining. All images are in dorsal view with anterior towards the right bottom corner.

EXPRESSION / LABELING:
Antibody:
Fish:
Anatomical Term:
Stage Range: Prim-25 to Long-pec
PHENOTYPE:
Fish:
Observed In:
Stage Range: Prim-25 to Long-pec

Unillustrated author statements

Acknowledgments
This image is the copyrighted work of the attributed author or publisher, and ZFIN has permission only to display this image to its users. Additional permissions should be obtained from the applicable author or publisher of the image. Full text @ PLoS One