
- Title
-
Pax2/8 act redundantly to specify glycinergic and GABAergic fates of multiple spinal interneurons
- Authors
- Batista, M.F., and Lewis, K.E.
- Source
- Full text @ Dev. Biol.
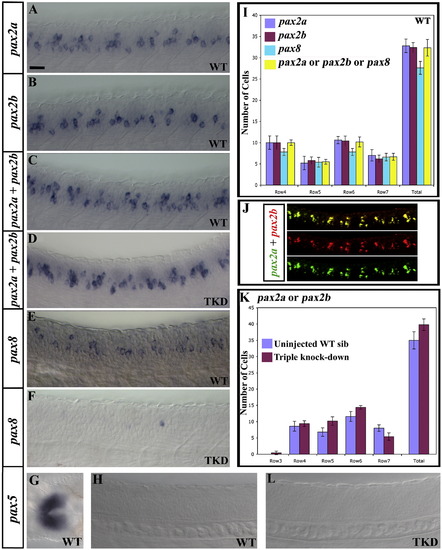
Expression of pax2 and pax8 genes in zebrafish spinal cord. pax2a, pax2b and pax8 are co-expressed by many cells but pax5 is not expressed in zebrafish spinal cord. Lateral views of pax2a (A), pax2b (B), pax2a and pax2b (C and D; probes were mixed), pax8 (E and F), pax5 (H and L) and pax2a and pax2b (J; pax2a in green and pax2b in red) expression in 24 h wild-type (WT) trunks (A–C, E and H) and triple-knock-down (TKD) embryos (pax2a mutants injected with pax2b and pax8 MOs) (D, F and L). pax8 staining is weaker than pax2a and pax2b and hard to photograph. This means that several weak pax8-expressing cells are hard to see in (E). However, when pax8-expressing cells were counted, similar numbers were obtained to when pax2a- or pax2b-expressing cells were counted (see I). (G) shows a dorsal view of the midbrain–hindbrain boundary of a 24 h wild-type embryo (a region of the embryo where pax5 is expressed, to show that this in situ hybridisation probe works). (J) shows merged and single channel images of a 2 colour fluorescent double in situ with pax2a in green and pax2b in red. In all cases, rostral is left. In all cases except (G), dorsal is top. Scale bar = 25 μm (A–H and L); 18 μm (J). (I) Average number of cells expressing pax2a, pax2b, pax8 and pax2a, pax2b or pax8 (probes were mixed) at 24 h in 5 different WT embryos. As the number of cells expressing pax2a, pax2b, pax8 or (pax2a, pax2b or pax8) are not statistically different from each other, these genes must be co-expressed in spinal cord cells. (K) Average number of cells expressing pax2a or pax2b (probes were mixed) in 12 uninjected noi sibs and 12 TKD embryos. In this and all other figures, cells were counted in a 5-somite length of spinal cord adjacent to somites 6–10. Cell row numbers are counted ventral to dorsal (e.g. cells directly above the notochord are in row 1, see Supp. Data Fig. 1F). Rows not shown have a cell count of zero. None of the differences in (I) and (K) are statistically significant. Error bars denote standard deviation. EXPRESSION / LABELING:
|
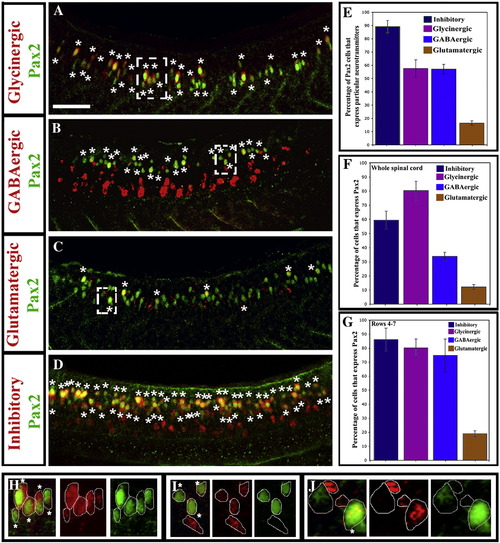
Most Pax2-expressing zebrafish spinal interneurons are inhibitory. Lateral views of Pax2 immunohistochemistry and in situ hybridisation for markers of glycinergic (A), GABAergic (B) glutamatergic (C) and GABAergic or glycinergic (labelled “inhibitory”; probes were mixed) (D) cell fates in 24 h WT trunks. See Materials and methods for details of probes used. Stars indicate double labelled cells. Rostal is left, dorsal is top. Scale bar = 50 μm. (E) Percentage of Pax2-expressing cells with particular neurotransmitter phenotypes. (F and G) Percentage of cells with specific neurotransmitter phenotypes that express Pax2 in whole spinal cord (F) or just the Pax2-expression domain (rows 4–7; G). In all cases, percentages are averages from 5 different embryos at 24 h. Error bars denote standard deviation. Note that most glycinergic cells are found in the Pax2/8 expression domain but many GABAergic cells are found more ventrally in the spinal cord (A and B; also cf. F and G). (H–J) Magnified views of dashed white boxes in A (H), B (I) and C (J) respectively showing red and green channels and merged images for a single confocal focal plane. Stars in merged images indicate double labelled cells. For single channel images of the whole lateral view see Supp. Data Fig. 2. EXPRESSION / LABELING:
|
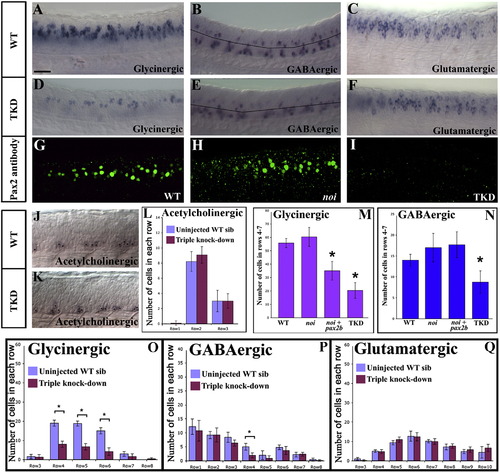
Pax2/8 act redundantly to specify inhibitory fates. Lateral views of in situ hybridisation for markers of glycinergic (A and D), GABAergic (B and E) glutamatergic (C and F) and acetylcholinergic (J and K) cell fates at 24 h in WT (A–C and J) and triple-knock-down (TKD) trunks (D–F and K). In (J and K) stars indicate cells expressing the acetylcholinergic marker, chat. In these photographs, some of the weaker cells are in a slightly different focal plane (on the other side of the spinal cord). In (B and E) the black line indicates the boundary between dorsal GABAergic cells within the Pax2/8 expression domain (rows 4–7) and more ventral GABAergic cells. Note that most remaining GABAergic cells in (E) are in the ventral region where Pax2/8 are not expressed and that none of the acetylcholinergic cells are within the Pax2/8 expression domain in either wild-type (J) or TKD (K) embryos. Rostal is left, dorsal is top. Scale bar = 40 μm. Immunohistochemistry for Pax2 in WT (G), noi (pax2a) mutant (H) and TKD (I) embryos. As Pax2 staining is present in (H) the antibody must recognise Pax2b. Therefore, lack of staining in (I) suggests that we have eliminated Pax2a + Pax2b protein in TKD embryos. (M and N) number of glycinergic and GABAergic cells at 24 h in Pax2/8 expression domain in WT, single-, double- and triple-knock-down embryos. Stars indicate statistically significant results (p < 0.05). For results in whole spinal cord see Supp. Data Figs. 4C and C′. For results of additional single and double knock-down experiments see Supp. Data Fig. 3 and Supp. Data Tables 1 and 2. (L and O–Q) show results for control and TKD embryos for all 4 neurotransmitters, broken down row by row. Rows not shown have a cell count of zero. In all cases, error bars denote standard deviation. The number of glycinergic and GABAergic cells is reduced in the Pax2/8 expression domain in TKD embryos but there is no significant change in the number of glutamatergic or acetylcholinergic cells in any region of the spinal cord. EXPRESSION / LABELING:
|
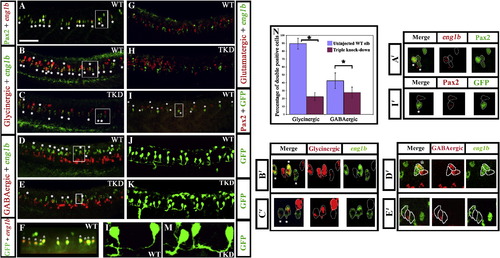
Pax2/8 specify inhibitory fates in CiA interneurons. Lateral views of 24 h trunks. (A, B, D and G) WT embryos, (C, E and H) triple-knock-down (TKD) embryos, (F, I, J and L) Tg(pax2a:GFP) WT embryos (K and M) Tg(pax2a:GFP) TKD embryos. Rostal is left, dorsal is top. (A) Pax2 (green), eng1b (red). (B–E, G and H) Double in situ hybridisation for eng1b (green) and neurotransmitter markers (red). eng1b staining is weaker in some pictures, but the same number of eng1b-expressing cells (13.9 ± 1.8 over a 5-somite length) were counted in each embryo (control and TKD). (F) Eng1b (red), GFP (green). The vast majority of GFP-positive cells in Tg (pax2a:GFP) embryos are CiAs and express Eng1b, although there are also a few more dorsal GFP-positive cells that are not CiAs. Occasionally a weak Eng1b-expressing cell can be observed that is not yet expressing GFP. (I) Pax2 (red), GFP (green). Note that all green cells are also red but several red cells are not green. (J–M) GFP (green). All of the ventral GFP-expressing cells are CiAs with similar ipsilateral ascending axons. (L and M) show higher magnification views of individual GFP-expressing CiAs in Tg(pax2a:GFP) WT (L) and TKD (M) embryos. For quantification of soma size and axon length see Supp. Data Table 3. Stars indicate double labelled cells. Scale bar = 50 μm (A–E and G–I); 30 μm (F, J and K). (N) Percentage of CiAs (eng1b-expressing cells) that are glycinergic or GABAergic in WT and TKD embryos. Each percentage is an average from 12 different embryos. Stars indicate statistically significant results (p < 0.05). Error bars denote standard deviation. No glutamatergic CiAs were observed in any embryo. (A′–E′ and I′) are magnified views of boxes in A–E and I respectively, showing red and green channels and merged images for a single confocal focal plane. Stars in merged images indicate double labelled cells. For single channel images of the whole lateral view for A–E and I see Supp. Data Fig. 6. EXPRESSION / LABELING:
|
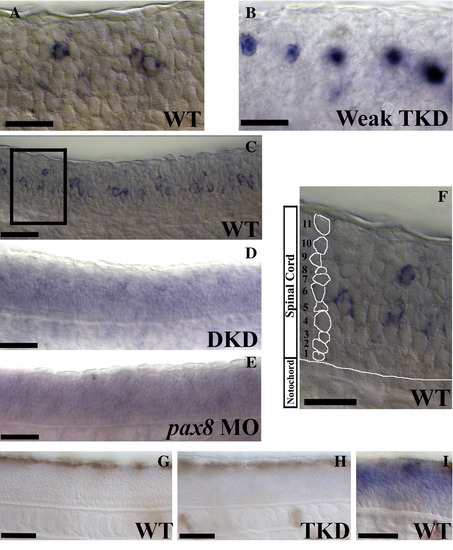
Lateral views of pax8 expression in 24 h trunks (A–F) and p53 expression in 36 h trunks (G–I). pax8 morpholinos block the splicing of pax8 RNA causing it to be retained in the nucleus (see discussion of splice-blocking morpholinos in Yan et al., 2002). (A) Cytoplasmic pax8 RNA in wild-type embryos; (B) unspliced nuclear pax8 RNA in noi (pax2a) mutants injected with 1 mg/ml each of pax2b and pax8 MOs (“weak” triple knock-down (TKD) embryos). When these morpholinos are injected at a higher concentration, expression of pax8 is lost (see Fig. 1F in the main paper). pax8 expression depends at least partly on Pax2 function. In noi mutants injected with 1.5 mg/ml pax2b MO (double knock-down (DKD) embryos), the expression of pax8 is dramatically reduced (D and cf. C). While pax8 expression is very weak in these embryos, it is more substantial than in triple-knock-down (TKD) embryos (cf.Fig. 1F in the main paper) suggesting either that Pax8 acts redundantly with Pax2 in regulating its own expression and/or that any remaining pax8 RNA in TKD embryos is degraded (probably because the pax8 splice-blocking MOs have prevented it from being processed properly). In support of the latter hypothesis, pax8 expression is almost completely lost in wild-type embryos injected with pax8 morpholino alone (E), although this could also indicate that Pax8 function is required for pax8 expression in the spinal cord. (F) is a higher magnification of the box in (C) demonstrating how cell rows were counted. For each positive cell, the number of cells between it and the notochord were counted to determine which row it was in. Example row numbers are illustrated for the column of cells on the left of the picture. p53 expression is not activated in TKD embryos. (G) shows that p53 is not expressed in 36 h WT trunks and (H) shows that this is also the case in 36 h TKD trunks. (I) is a control to show that the in situ hybridisation is working: this photograph shows p53 expression in a damaged 36 h WT embryo. Scale bars = 25 μm (A, B and F) and 50 μm (C–E and G–I). EXPRESSION / LABELING:
|
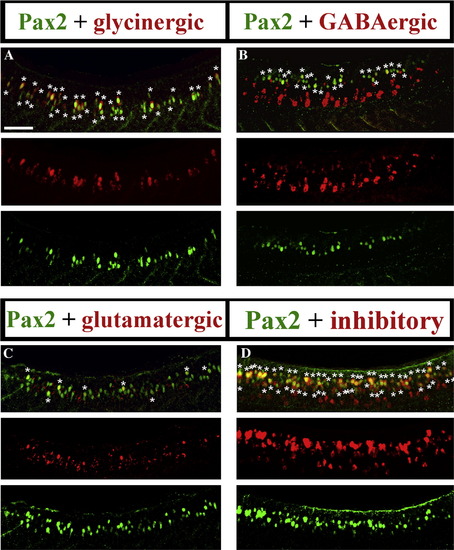
Lateral views of Pax2 immunohistochemistry and in situ hybridisation for markers of glycinergic (A), GABAergic (B) glutamatergic (C) and GABAergic or glycinergic (labelled “inhibitory”; probes were mixed) (D) cell fates in 24 h WT trunks. See Materials and methods for details of probes used. The pictures in this figure are the same as in Fig. 2 in the main paper — but this supplementary data figure also shows single channel images for each result. Stars in merged images indicate double labelled cells. Rostal is left, dorsal is top. Scale bar = 50 μm. EXPRESSION / LABELING:
|
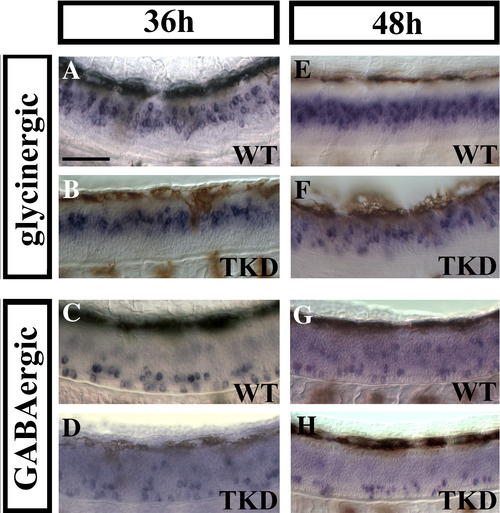
Triple knock-down embryos still have reduced numbers of glycinergic and GABAergic spinal neurons at 36 h and 48 h. Lateral views of in situ hybridisation for markers of glycinergic (A, B, E and F) and GABAergic (C, D, G and H) cell fates in wild-type (WT; A, C, E and G) and triple knock-down (TKD; B, D, F and H) trunks at 36 h (A–D) and 48 h (E–H). (Cell counts for this data are shown in Supp. Data Figs. 4A and A′.) Brown cells are melanophores that have differentiated and started to migrate by these stages. Rostal is left, dorsal is top. Scale bar = 50 μm. |
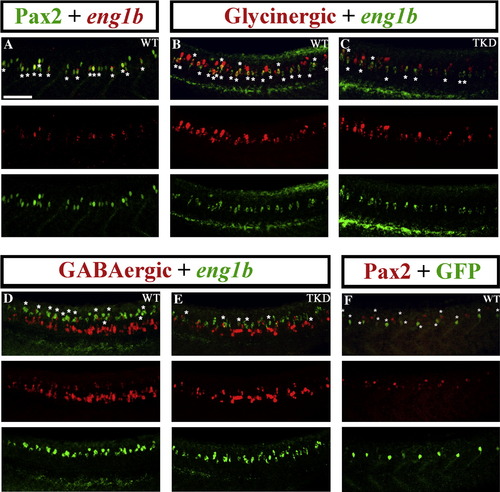
Lateral views of wild-type (WT; A, B and D) triple-knock-down (TKD; C and E) and Tg(pax2a:GFP) (F) trunks at 24 h. Rostal is left, dorsal is top. (A) Pax2 (green), eng1b (red). (B–E) Double in situ hybridisation for eng1b (green) and neurotransmitter markers (red). (F) Pax2 (red), GFP (green). The pictures in this figure are the same as in Fig. 2 in the main paper — but this supplementary data figure also shows single channel images for each result (and panel F in this figure was panel I in Fig. 4 in the main paper). Stars in merged images indicate double labelled cells. Scale bar = 50 μm. EXPRESSION / LABELING:
|
Reprinted from Developmental Biology, 323(1), Batista, M.F., and Lewis, K.E., Pax2/8 act redundantly to specify glycinergic and GABAergic fates of multiple spinal interneurons, 88-97, Copyright (2008) with permission from Elsevier. Full text @ Dev. Biol.