
- Title
-
Zebrafish V2 cells develop into excitatory CiD and Notch signalling dependent inhibitory VeLD interneurons
- Authors
- Batista, M.F., Jacobstein, J., and Lewis, K.E.
- Source
- Full text @ Dev. Biol.
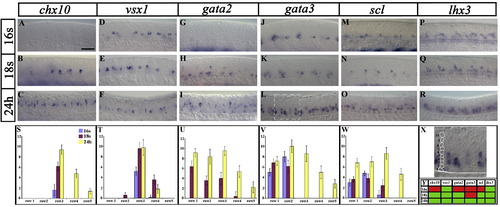
Expression of V2 transcription factors in wild-type embryos. (A–R and X) Lateral views of the spinal cord and underlying notochord in wild-type embryos at 16 somites (17 h), 18 somites (18 h) and 24 h. Anterior is left, dorsal is up. Scale bar = 50 μm (A–R). (A–F) chx10 and vsx1 are expressed in the V2 domain (rows 3–5 depending on stage). (G–R) lhx3, scl, gata3 and gata2 are expressed both in the V2 domain and more ventral spinal cells. At 16 somites, vsx1 (D) and lhx3 (P) are already expressed in the V2 domain, but gata2 (G), gata3 (J), scl (M) and chx10 (A) are not. By 18 somites gata2 (H) and scl (N) are also expressed in the V2 domain. (S–W) number of cells in rows 1–5 expressing particular genes at 16 s (blue bars), 18 s (red bars) and 24 h (yellow bars). None of these genes were expressed in cells dorsal to row 5. All cell counts are from a 5 somite length of spinal cord adjacent to somites 6–10. Values shown are the mean from 5 different embryos. Error bars indicate standard deviations. Panel X shows a magnified view of the white dotted box in panel L demonstrating how cell rows were counted. For each positive cell, the number of cells between it and the notochord were counted to determine which row it was in. Cell row numbers were counted ventral to dorsal (e.g. cells directly above the notochord are in row 1). Example row numbers are illustrated for the column of cells on the left of the picture. Panel Y shows a schematic representation of when genes are expressed in the V2 domain (red: gene not expressed at that time point in the V2 domain, green: gene expressed at that time point in the V2 domain). EXPRESSION / LABELING:
|
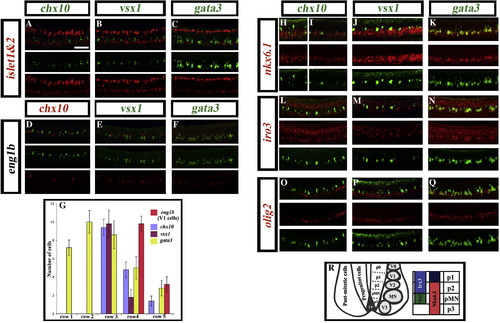
Expression of transcription factors in the V2 domain. Lateral views of double in situ hybridisation in wild-type trunks at 24 h. islet1 and islet2 (probes mixed) are shown in red (A–C); eng1b is shown in green (D) and red (E and F); chx10 is shown in green (A, H, I, L and O) and red (D); vsx1 is shown in green (B, E, J, M and P); gata3 is shown in green (C, F, K, N and Q); nkx6.1, iro3 and olig2 are all shown in red (H–Q). Panel H shows expression in the anterior of the embryo and panel I shows expression in the posterior of the embryo. Scale bar = 50 μm. (G) Graph showing the number of cells in rows 1–5 at 24 h expressing V2 markers gata3, chx10 or vsx1 or V1 marker eng1b. None of these genes are expressed dorsal to row 5 at this stage. All cell counts are from a 5 somite length of spinal cord adjacent to somites 6–10. Values shown are the mean from 5 different embryos. Error bars indicate standard deviations. (R) Schematic showing the dorsal–ventral location of different ventral post-mitotic interneuron domains (V0–V3), the motoneuron domain (MN) and transcription factors that demarcate the p2 progenitor domain. |
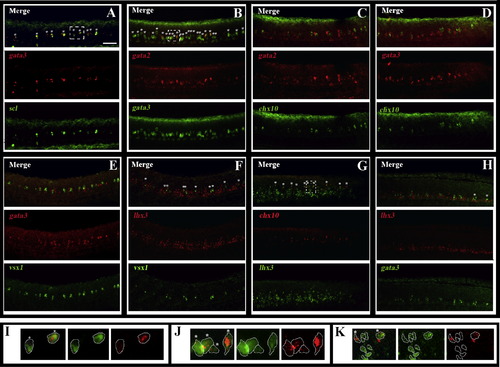
Zebrafish spinal cord contains both V2a and V2b cells. Lateral views of wild-type trunks at 24 h. Double in situ hybridisation showing gata3 (A, D and E), gata2 (B and C), lhx3 (F and H), and chx10 (G) expression in red and chx10 (C and D), gata3 (B and H), vsx1 (E and F), scl (A) and lhx3 (G) in green. Single channel views and merged images are shown. Anterior is left, dorsal is up. Scale bar = 50 μm. panel I shows a single focal plane magnified image of the dashed white box in panel A. Panel J shows a single focal plane magnified image of the dashed white box in panel B. Panel K shows a single focal plane magnified image of the dashed white box in panel G. Merged images are on the left, followed by the single green channel and then the single red channel. Cell outlines are traced in white. In all cases, stars in merged images indicate double-labelled cells. |
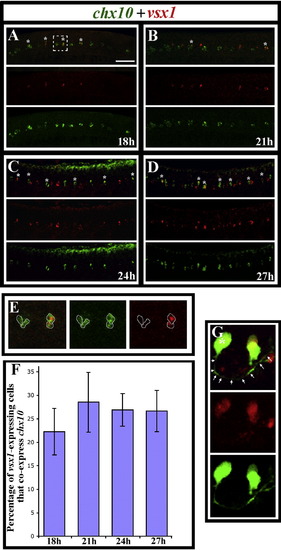
vsx1 and chx10 are co-expressed by subsets of vsx1- and chx10-expressing cells. Lateral views of the spinal cord in wild-type trunks at (A) 18 h (18 somites), (B) 21 h, (C) 24 h and (D) 27 h. Double in situ hybridisations showing chx10 expression in green and vsx1 expression in red. Single channel views and merged images are shown. Anterior is left, dorsal is up. Scale bar = 50 μm (A–D). Double-labelled cells are indicated with stars. Panel E shows single focal planes of a higher magnification view of the white dashed square in panel A. Merged image is on the left, followed by the single green channel and then the single red channel. Cell outlines are traced in white. The 2 cells on the left only express chx10; the 2 cells on the right express both chx10 and vsx1. Panel F shows the percentage of vsx1-expressing cells that co-express chx10 at different stages. Cell counts are from a 5 somite length of spinal cord adjacent to somites 6–10. Values shown are the mean from 5 different embryos. Error bars indicate standard deviations. Panel G shows a vsx1-expressing cell with a clear CiD morphology in a 24 h Tg(chx10:Kaede) embryo. Single channel views and a merged image are shown. vsx1-expression is red. Kaede-positive cells are green. Star indicates cell body and arrows indicate the associated axon. EXPRESSION / LABELING:
|
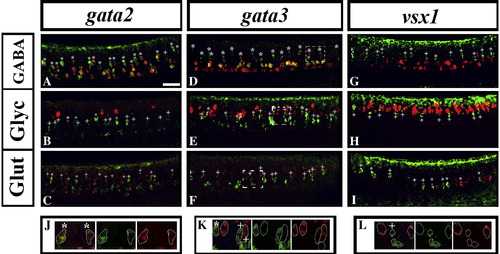
V2b cells are inhibitory and V2a cells are excitatory. Lateral views of the spinal cord in wild-type trunks at 24 h. Double in situ hybridisation merged images showing GABAergic markers (A, D and G), glycinergic markers (B, E and H) and glutamatergic markers (C, F, and I) in red, and gata2 (A–C), gata3 (D–F) and vsx1 (G–I) in green. Anterior is left, dorsal is up. Scale bar = 50 μm. Panel J shows a single focal plane magnified image of the dashed white box in panel D. Panel K shows a single focal plane magnified image of the dashed white box in panel E. Panel L shows a single focal plane magnified image of the dashed white box in panel F. In these higher magnification views, merged images are on the left, followed by the single green channel and then the single red channel. In all merged images, double-labelled cells in the V2 domain are indicated with stars. V2 cells not expressing a particular neurotransmitter (single-labelled green cells) are indicated with crosses. For quantification of these results see Fig. 6. |
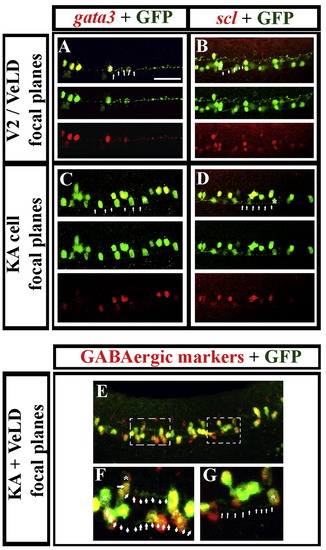
Zebrafish V2b cells are VeLDs and ventral gata/scl-expressing cells are KAs. Lateral views of the spinal cord of Tg(8.1kGata1:eGFP) embryos (Kobayashi et al., 2001) at 24–25 h. Immunohistochemistry for GFP (green) and in situ hybridisation for gata3 (red; A and C), scl (red; B and D) or GABAergic markers (red; E–G). Single channel views and merged images are shown for panels A–D. Panels A and B are projections of multiple optical sections at the focal levels at which V2 cells/VeLDs are found. Panels C and D are projections of multiple optical sections at the focal levels at which KA cells are found. Merged images are on top followed by green channel and then red channel images. Panels E–G are projections of multiple optical sections that include the focal levels at which V2 cells/VeLDs and KA cells are found. Panel F is a higher magnification view of the left hand white dotted box in panel E indicating the morphology of 2 VeLDs and panel G is a higher magnification view of the right hand white dotted box in panel E indicating the morphology of a KA cell. Example cell morphologies are indicated by a star in the cell soma and arrow heads pointing to the axon trajectory of that cell. All of the GFP-positive cells express gata3, scl and GABAergic markers. Anterior is left, dorsal is up. Scale bar = 50 μm (A–E). EXPRESSION / LABELING:
|
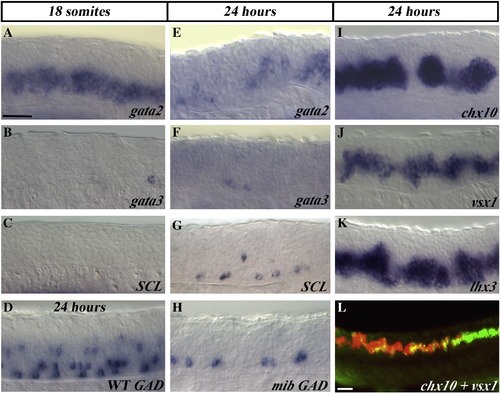
V2a cells are expanded and V2b cells are lost in mind bomb mutants. Lateral views of spinal cord gene expression in mib mutant trunks at 18 somites (18 h) (A–C) and 24 h (E–L). (D) Wild-type embryo at 24 h. In panel L chx10 expression is shown in red and vsx1 in green. GAD is a marker of GABAergic cells (see Materials and methods). Anterior is left, dorsal is up. Scale bar = 50 μm. scl expression in mib mutants is slightly variable. Some embryos have very few remaining cells, as is shown for gata3 in panel F, but other embryos have slightly more remaining ventral cells as shown in panel G. EXPRESSION / LABELING:
PHENOTYPE:
|
Reprinted from Developmental Biology, 322(2), Batista, M.F., Jacobstein, J., and Lewis, K.E., Zebrafish V2 cells develop into excitatory CiD and Notch signalling dependent inhibitory VeLD interneurons, 263-275, Copyright (2008) with permission from Elsevier. Full text @ Dev. Biol.