
- Title
-
Regulation of zebrafish skeletogenesis by ext2/dackel and papst1/pinscher
- Authors
- Clément, A., Wiweger, M., von der Hardt, S., Rusch, M.A., Selleck, S.B., Chien, C.B., and Roehl, H.H.
- Source
- Full text @ PLoS Genet.
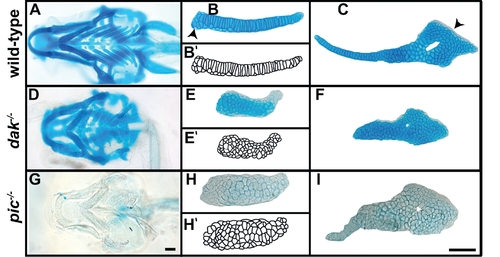
dak-/- and pic-/- larvae have similar cartilage morphogenesis phenotypes. Skeletal preparations of wild-type (A–C), dak-/- (D–F) and pic-/- (G–I) at day 6 reveal the shape of the cartilaginous skeleton as well as chondrocyte morphology. Ventral views of the head show that the cartilage elements of dak-/- and pic-/- fish are shorter and thicker than wild-type (A,D,G). Dissected cartilage laid flat show a complete lack of chondrocyte flattening and intercalation in skeletal elements from dak-/- and pic-/- larvae (B,E,H ceratobranchial 1; C,F,I hyosymplectic). Arrowheads in B and C indicate regions that lack stacking in wild-type embryos. Alcian Blue staining at pH1.0 (HCl 0.1N) does not stain pic-/- cartilage (G,H,I). Camera lucida drawings of chondrocytes in wild-type and mutant larvae (B′,E′,H′). Scale bars = 50μM. PHENOTYPE:
|
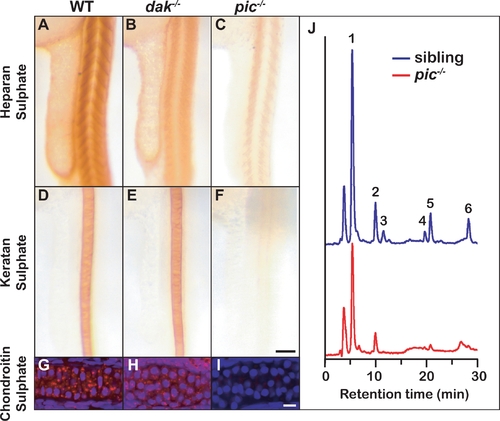
Sulphated proteoglycans are reduced in dak-/- and pic-/- larvae. Whole mount antibody staining at 24hpf reveals that HS is reduced in the somites of dak-/- and pic-/- (A–C) and KS in the notochord is reduced only in pic-/- larvae (D–F). Cartilage staining of the ceratohyal at 72hpf reveals that CS is made in wild-type and dak-/- chondrocytes (red stain in G,H), and absent from pic-/- cartilage (I) (nuclear staining is shown in blue with DAPI). HPLC analysis of HS in pic-/- larvae at day 5 indicates that sulphated disaccharides are nearly absent and unsulphated disaccharides are reduced (red) compared to their siblings (blue) (J). 1: ΔUA-GlcNAc, unsulfated Δ4,5-unsaturated hexuronate -N-acetyl glucosamine; 2: ΔUA-GlcNS, ΔUA-N-sulfated glucosamine; 3: ΔUA-GlcNAc6S, ΔUA-6-O-sulfated GlcNAc; 4: ΔUA-GlcNS6S, ΔUA-N-sulfated, 6-O-sulfated glucosamine; 5: ΔUA2S-GlcNS, 2-O-sulfated ΔUA-N-sulfated glucosamine; 6: ΔUA2S-GlcNS6S, 2-O-sulfated ΔUA-N-sulfated, 6-O-sulfated glucosamine. These disaccharides correspond to the major disaccharides found in both invertebrate and vertebrate animals. Panel F scale bar = 50μM. Panel I scale bar = 10μM. EXPRESSION / LABELING:
|

pic-/- encodes a PAPS transporter. Genetic map of pic locus (A). Note that z1534 has not been assigned a genetic position as it was found on the RH map. Allele sequencing identifies picto216z as a premature stop codon in exon 3 and picto14mx as a deletion of exon 3 (B). Zebrafish PAPST1 clusters with human and Drosophila PAPST1 in a dendrogram (C). Expression of wild-type PAPST1 in a single notochord cell rescues synthesis of KS in pic-/- larvae (D–E). Close-up of single cell secreting KS in brown (arrow in E), and the same cell counterstained for the rescue construct reporter in purple (arrow in F). The dendrogram was made using Clustal W and Treeview68k. Accession numbers: AB107958, NP_648954, AB106538, NP_057032, NP_991198, NP_001035084, NM_005827. Zebrafish and human PAPST1 share 70% amino acid identity. Panel D scale bar = 100μM. Panel E scale bar = 50μM. |
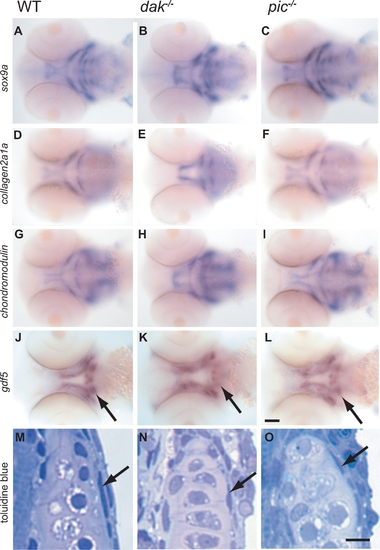
dak-/- and pic-/- larvae have wild-type levels of expression of markers of chondrocyte differentiation. Wholemount RNA in situ analysis of sox9a (A–C), collagen2a1a (D–F), chondromodulin (G–I) and gdf5 (J–L) at 60hpf (all ventral views of the head). Although the position of the developing skeleton varies between wild-type and mutants, the markers are expressed at similar levels in wild-type (A,D,G,J), dak-/- (B,E,H,K) and pic-/- (C,F,I,L). dak-/- larvae express sox9a at higher levels anteriorly, but this is perhaps due to more chondrogenic cells being present (see Figure 6). Expression of gdf5 in the perichondrium of the ceratohyal is present albeit slightly reduced in dak-/- and pic-/- (arrows in J–L). The perichondrium of the hyosymplectic is also seen in toluidine blue stained sections at day 5 (arrows in M,N,O). Panel I scale bar = 50μM. Panel L scale bar = 5μM. EXPRESSION / LABELING:
|
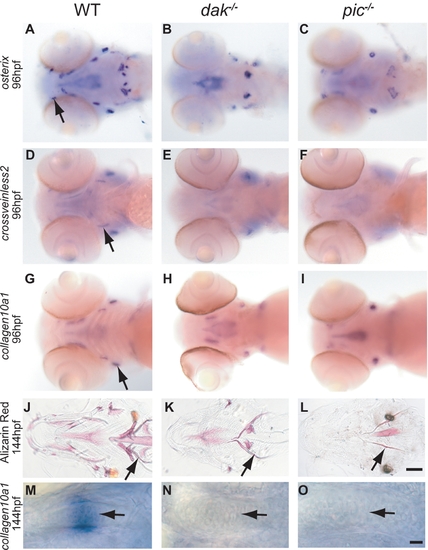
Reduction of bone development in dak-/- and pic-/- larvae. Wholemount RNA in situ analysis of osterix (A–C), crossveinless (D–F) and collagen10a1 (G–I) at 96hpf (all ventral views of the head). Markers for dermal and cartilage bone development are down-regulated or absent in both mutants (A,D,G wild-type; B,E,H dak-/-; C,F,I pic-/-). Arrows indicate wild-type expression in the maxilla (A), branchiostegal ray (D) and opercle (G). The loss of marker gene expression is consistent with the later reduction in bone formation in ventral views of 6 day old larvae stained with Alizarin Red (J,K,L). Arrows indicates the location of the cleithrum in J, K and L. Table S2 lists all of the affected bones. collagen10a1 expression in chondrocytes of the ceratohyal in wild-type larvae marks chondrocytes as they become hypertrophic (arrow in M). This expression is absent in dak-/- (N) and pic-/- (O) larvae. Panel L scale bar = 100μM. Panel O scale bar = 10μM. |

Condensation morphogenesis is absent in dak-/- larvae. Pre-cartilage condensations in the first arch are larger in dak-/- larvae as judged by sox9a staining at 45hpf (A,B) and 50hpf (C,D). Individual cells within the condensation appear to have a more rounded morphology in dak-/- larvae than in wild-type larvae (compare arrows in C,D). Intercalation and flattening of chondrocytes to give rise to the ceratohyal cartilage in the second arch takes place between 54 and 58hpf in wild-type (E,G), but does not occur in dak-/- larvae (F,H). Chondrocytes begin to secrete cartilage matrix during this time as seen by Alcian Blue staining (G,H). Camera lucida drawings of chondrocytes in wild-type and dak-/- larvae (E′–H′). Scale bars = 10μM. |

Cell autonomous behaviour of dak-/- and pic-/- chondrocytes. Transplanted dak-/- cells usually form columns with wild-type chondrocytes (arrow in B). However, in some cases dak-/- cells grow out from the wild-type host cells and behave autonomously (arrowheads in C,D,E). pic-/- cells transplanted into wild-type hosts never stack (arrowheads in F,G). In addition, wild-type cells both stack (arrows in H,I) and fail to stack (arrowheads in H,I) when transplanted into pic-/- hosts. Wild-type cells that stack in pic-/- hosts form columns that lie parallel to the longitudinal axis (grey arrow in I). (A–I) Dissected cartilage elements; all are ceratobrachial cartilage except (E) and (I) which are trabecular and ceratohyal cartilage respectively. Brown cells in (A–G) are transplanted cells, blue cells in (H,I) are transplanted cells. (J) summarises all 63 transplants analysed. Transplanted cells that flattened also intercalated to form columns. WT = wild-type. |
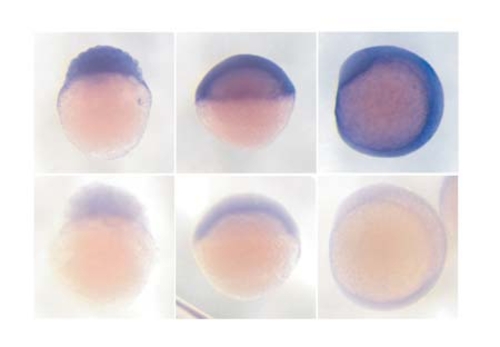
papst1 is expressed ubiquitously. mRNA in situ analysis of papst1 expression: antisense (A–C) and sense (A prime–C prime) probes at the 30–60 cells stage (A, A prime), 50% epiboly stage (B, B prime) and 7 somites stage (C, C prime). EXPRESSION / LABELING:
|

The 10E4 epitope is not expressed in the developing cartilage. Wildtype (A,C,E) and pic-/- (B,D,F) localisation of the 10E4 epitope (in green) at 60hpf. Cartilage (collagen type II) is shown in red and nuclei in blue (C–F). Side views of the whole fish (A,B), ventral views of the head (C,D) and high magnification pictures of the ceratohyal (E,F). The 10E4 epitope is detected predominantly on basal laminae but is undetectable in the developing cartilage at the time of chondrocyte stacking. Panel D scale bar = 100μM. Panel F scale bar = 10μM. EXPRESSION / LABELING:
|

Unillustrated author statements PHENOTYPE:
|