
- Title
-
Hh and Wnt signaling regulate formation of olig2(+) neurons in the zebrafish cerebellum
- Authors
- McFarland, K.A., Topczewska, J.M., Weidinger, G., Dorsky, R.I., and Appel, B.
- Source
- Full text @ Dev. Biol.

Transgenic reporter gene expression recapitulates endogenous olig2 RNA expression in zebrafish cerebellum. Lateral whole mount views and sagittal sections are shown with dorsal up and anterior to the left. Transverse sections are oriented dorsal up. Midbrain (mb), hindbrain (hb) and medulla oblongata (mo) are marked. (A–D) Developmental time course of olig2 expression detected by in situ RNA hybridization in whole embryos. Dashed circles mark where cerebellum is located. (E–G) EGFP expression driven by the Tg(olig2:egfp) transgene in live embryos. Expression within cerebellum is circled. (H–J) Sagittal sections through cerebellum with olig2 RNA expression marked by arrows. (K–M) Arrows mark EGFP+ cells in cerebellum of sagittally sectioned Tg(olig2:egfp) embryos and arrowheads show axonal extensions from EGFP+ cells. Transverse sections through cerebellum showing olig2 RNA (N–P) and EGFP (Q–S) expression marked by arrows. Scale bars represent 20 μm in all panels. |

Identification of cerebellar cell types reveals distinct populations of olig2+ neurons organized along the DV axis. (A–C) Sagittal section through cerebellum of 48 hpf Tg(olig2:egfp) transgenic embryo showing EGFP+ cells expressed Hu (red). Arrowheads mark long axonal projections. (D) Dorsal view with anterior to left of one-half of the cerebellum in living Tg(olig2:egfp) embryo at 56 hpf. Bracket and arrowheads mark EGFP+ axons extending from EGFP+ cells ventrally along midbrain–hindbrain boundary. (E) Dorsal view of cerebellum in living Tg(olig2:egfp) larva at 7 dpf, anterior is along the bottom. Bracket indicates extensive dendritic branches originating from EGFP+ cells. (F) 3-D reconstruction of 5 dpf sagittal section of a Tg(olig2:egfp) larva illustrating DV organization of Zebrin II+ (green), EGFP+ (blue) and Calretinin+ (red) cells. Arrowhead marks ventrally extending EGFP+ axons. (G) Transverse section a 5 dpf Tg(olig2:egfp) larva showing Zebrin II, EGFP and Calretinin labeling of distinct populations and DV arrangement. (H–J) Sections of 14 dpf Tg(olig2:egfp) transgenic larvae labeled with Calretinin, Parvalbumin and Zebrin II antibodies. (H) Transverse hemisection shows EGFP+ cells dorsal to Calretinin+ eurydendroid cells. (I) Transverse hemisection showing EGFP+ cells intermixed with Zebrin II+ Purkinje neurons. Inset shows enlargement of area framed by dashed lines. (J) Sagittal section showing distinct populations of Parvalbumin+ Purkinje neurons and EGFP+ neurons. Arrowheads mark EGFP+ axons extending toward deep brainstem. Inset shows enlargement of area framed by dashed lines. Scale bar = 20 μm for all panels except panel G, for which it represents 40 μm. EXPRESSION / LABELING:
|
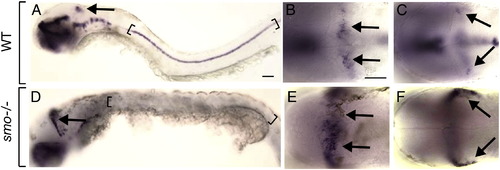
Hh signaling restricts cerebellar olig2 expression. Lateral (A, D) and dorsal (B, C, E, F) views of 48 hpf embryos with anterior to the left. Arrows indicate cerebellar olig2 expression. Brackets mark ventral spinal cord. (A) Wild-type embryo illustrating olig2 expression within cerebellum and spinal cord. Dorsal (B) and ventral (C) focal planes of wild-type cerebellum. (D–F) Similar views of olig2 expression in smo mutant embryo. Note expansion of cerebellar expression and absence of spinal cord expression. Scale bars represent 20 μm for all panels. EXPRESSION / LABELING:
|

Zebrafish cerebellum expresses wnt1 but not Hh pathway genes. All panels are lateral or dorsal views with anterior to the left. Dashed circles mark cerebellums. (A–C) Expression of shh was ventral to cerebellum. (D–F) Expression of ptc1 at 30 hpf was absent from cerebellum but by 48 hpf was present in the lower rhombic lip. (G, H) Expression of wnt1 at 30 hpf, red arrows mark transient wnt1 expression within the cerebellum and black arrows mark expression at the midbrain–hindbrain boundary. (I, J) By 48 hpf, wnt1 expression was no longer present within the cerebellum but persisted at the midbrain–hindbrain boundary. Scale bars represent 20 μm in all panels. |

Wnt signaling is necessary for cerebellar olig2 expression. All embryos shown are 48 hpf. Anterior is to the left in all panels, the first column depicts a lateral whole mount view, the second column a dorsal view and the third a lateral view of the spinal cord. Black arrows mark cerebellum, brackets mark ventral spinal cord and ventral diencephalon is labeled (di). (A–C) Wild-type olig2 expression. (D–F) Df(LG01:lef1)x8 (X8) mutant embryos expressed olig2 in spinal cord but not cerebellum. (G–I) Df(LG01:lef1)x8 mutant embryos treated with CA at 6 hpf expressed olig2 in ventral diencephalon but not cerebellum or spinal cord. (J–L) hsDkk1GFP embryos heat shocked at 30 hpf expressed olig2 in ventral diencephalon and spinal cord but not cerebellum. (M–O) hsDkk1GFP embryos treated with CA at 6 hpf expressed olig2 in ventral diencephalon but not spinal cord or cerebellum. Scale bars represent 20 μm in all panels. EXPRESSION / LABELING:
|
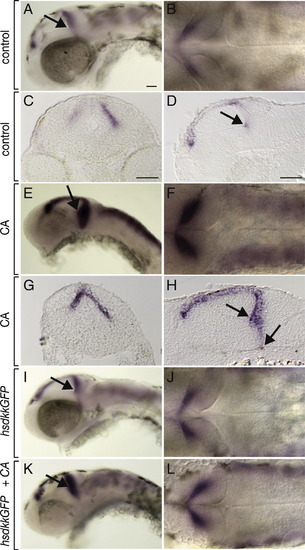
Inhibition of Hh signaling causes expansion of the wnt1 expression domain. All embryos shown are 48 hpf. Black arrows in whole mount views depict the morphological line of the midbrain adjoining the midbrain–hindbrain boundary. Lateral whole mount (A), dorsal whole mount (B), transverse section (C) and sagittal section (D) showing wnt1 expression in control embryos. The black arrows mark the base of the 3rd ventricle, with which the ventral extent of wnt1 expression coincides in the midbrain–hindbrain region. (E–H) Similar views of wnt1 expression in embryos treated with CA beginning at 6 hpf. wnt1 expression in the midbrain–hindbrain region is expanded both ventrally and posteriorly. (I, J) Expression of wnt1 in embryos that overexpressed Dkk1 at 30 hpf was similar to controls. (K, L) wnt1 expression was expanded in embryos treated with CA at 6 hpf and heat shocked to induce Dkk1 expression at 30 hpf. Scale bars represent 20 μm in all panels. EXPRESSION / LABELING:
|

atoh1a expression reveals cerebellum formation. All embryos shown are 48 hpf. Anterior is to the left in all panels, the first column depicts a lateral whole mount view, the second column a dorsal view. Black arrows point to the cerebellum. (A, B) Wild-type control embryos. Black dashed line indicates the width of the cerebellum (C, D) Embryos treated with CA at 6 hpf. From a dorsal view, the cerebellum appears thicker than in control embryos. Expression of atoh1a appears normal in transgenic embryos heat shocked to induce expression of Dkk1 at 30 hpf (E, F) and Df(LG01:lef1)x8 mutant embryos (G, H). Scale bars represent 20 μm in all panels. EXPRESSION / LABELING:
|
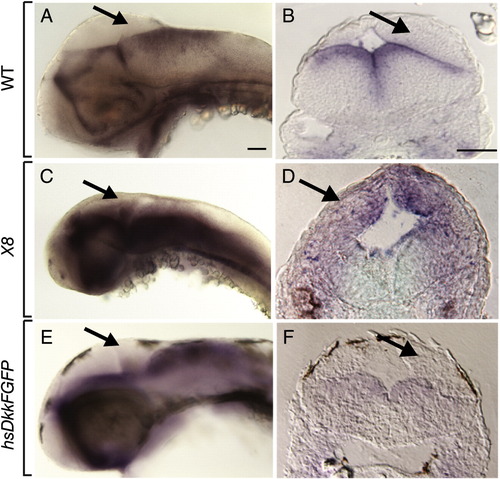
Effects of Wnt signaling on ptc1 expression. All embryos shown are 48 hpf. The first column are whole mount views with anterior to the left and the second column shows transverse sections through the cerebellum. (A, B) ptc1 expression is not evident within the cerebellum of wild-type embryos. (C, D) Df(LG01:lef1)x8 mutants show an expansion of ptc1 expression into the dorsal regions of the cerebellum. (E, F) ptc1 expression is not evident in the cerebellum of transgenic embryos heat shocked to induce Dkk1 at 30 hpf. Scale bars represent 20 μm in all panels. EXPRESSION / LABELING:
|
Reprinted from Developmental Biology, 318(1), McFarland, K.A., Topczewska, J.M., Weidinger, G., Dorsky, R.I., and Appel, B., Hh and Wnt signaling regulate formation of olig2(+) neurons in the zebrafish cerebellum, 162-171, Copyright (2008) with permission from Elsevier. Full text @ Dev. Biol.