- Title
-
Gateway compatible vectors for analysis of gene function in the zebrafish
- Authors
- Villefranc, J.A., Amigo, J., and Lawson, N.D.
- Source
- Full text @ Dev. Dyn.
|
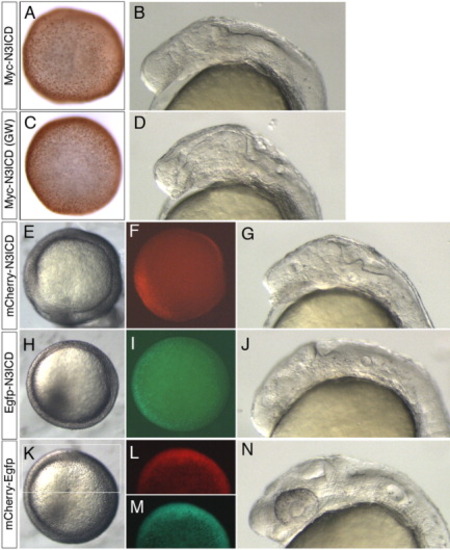
Validation of Gateway compatible N-term pCS vectors. A,B: Embryo injected with myc-notch3icd mRNA from plasmid generated through standard ligation-mediated cloning. C,D: Embryos injected with myc-notch3icd mRNA from plasmid generated through Gateway cloning (GW). A,C: Embryos fixed at 50% epiboly and immunostained to detect the myc epitope; dorsal view. B,D: Live embryos at 26 hpf, lateral view, anterior to the left. E-G: Embryos injected with mRNA encoding mCherry-Notch3ICD. H-J: Embryos injected with mRNA encoding Egfp-Notch3ICD. K-N: Embryos injected with mRNA encoding an mCherry-Egfp fusion. E,H,K: Dorsal views at 50% epiboly, images generated under standard transmitted light illumination of live embryos. F,L: Visualization of red fluorescence at 50% epiboly, dorsal views. I,M: Visualization of green fluorescence, dorsal views at 50% epiboly. G,J,N: Lateral views under transmitted light, dorsal is up, anterior to the left. All embryos injected with 100 pg of indicated mRNA. N3ICD, notch3 intracellular domain. |
|
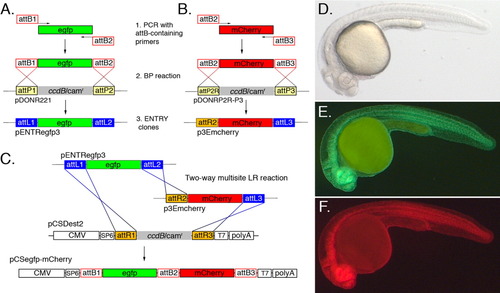
Multisite Gateway approach to generate C-terminal fusion proteins in a pCS-based vector. A: Generation of the pENTR-egfp3 plasmid by BP recombination between an attB1/attB2 flanked PCR product and pDONR221. The reverse attB2 primer was engineered to eliminate the stop codon in the Egfp coding sequence. B: Generation of a C-terminal mCherry tag (p3Emcherry) by BP cloning. In this case, the forward primer contains an attB2 site and the reverse primer an attB3 site. Recombination of the attB2-attB3 PCR product with pDONRP2r-P3 results in an ENTRY clone in which the mcherry coding sequence is flanked by attR2 and attL3. C: Depiction of the two-way multisite Gateway LR reaction between pENTRegfp3, p3Emcherry and pCSDest2. Recombination can only occur between corresponding attL and attR sites resulting in the proper orientation of egfp and mcherry ORFs in pCSegfp-mcherry. Note that att sites are not to scale. D-F: A 24 hours postfertilization embryo injected with 100 pg of egfp-mcherry mRNA synthesized from the plasmid generated in C; lateral view, dorsal is up, anterior to the left; all pictures are from the same embryo. D: Transmitted light illumination.E: Illumination to visualize green fluorescence.F: Illumination to visualize red fluorescence. |
|
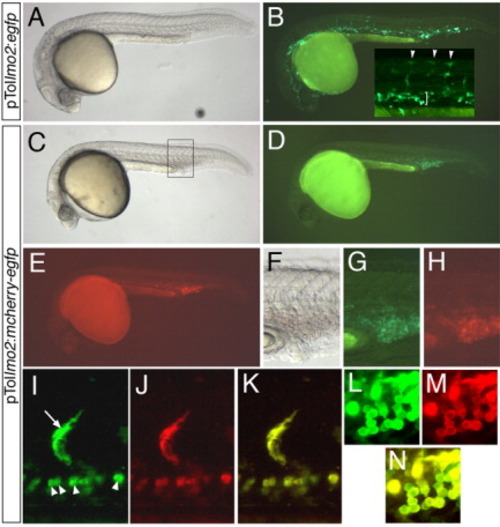
Validation of pTollmo2-Dest vectors. A-N: Injected embryos at 28 hours postfertilization, lateral views, dorsal is up, anterior to the left. A,B: Embryo injected with 25 pg of pTollmo2:egfp and 25 pg of transposase mRNA. A: Transmitted light image. B: Fluorescent image of embryo in A to visualize enhanced green fluorescent protein (Egfp) expression. Inset, higher magnification of trunk region, indicating Egfp expression in numerous segmental arteries (arrowheads) and intermediate cell mass (bracket). C-N: Embryos injected with 25 pg of pTollmo2:mcherry-egfp and 25 pg of transposase mRNA. C,F: Transmitted light image. D,G: Epifluorescence image to visualize Egfp expression. E,H: Epifluorescence image to visualize mCherry expression. F-H: Higher magnification view of caudal vein expression from embryo in C (box). I-N: Confocal micrographs; embryo is different than the one pictured in C. I: Green fluorescence of mCherry-Egfp in a segmental artery (arrow) and red blood cells (arrowheads). J: Red fluorescence of mCherry-Egfp. K: Overlay of green and red fluorescence from images in I and J. L: Green fluorescence of mCherry-Egfp in blood cells. M: Red fluorescence of mCherry-Egfp in blood cells. N: Overlay of green and red fluorescence from images in L and M. |
|
Multisite Gateway cloning to generate a tissue-specific Tol2 construct for expression of C-terminal fusion proteins. A: Three-way multisite reaction into pDestTol2pA. The egfp and mcherry Entry clones are the same as those used in Figure 4. Note that att sites are not to scale. B-G: Embryos injected with 25 pg transposase mRNA and 25 pg pTolbactin2:egfp-mcherry; lateral view, dorsal is up, anterior to the left. B: Transmitted light illumination. C: Illumination to visualize green fluorescence. D: Illumination to visualize red fluorescence. E-G: Confocal micrographs; embryo is different than the one pictured in B. E: Mosaic green fluorescence of Egfp-mCherry observed in epidermal cells (arrows) and muscle cells (arrowheads). F: Red fluorescence of Egfp-mCherry. G: Overlay of images in E,F. |
|
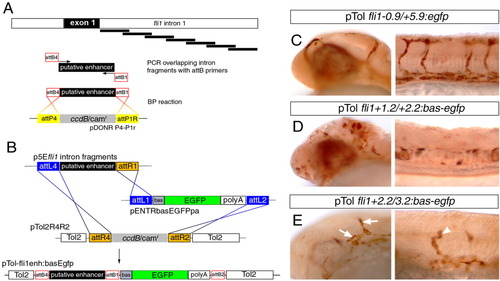
Identification of an endothelial enhancer in the fli1a first intron. A: Schematic description of polymerase chain reaction and BP cloning approach to generate overlapping 1-kb fragments for screening enhancer activity. B: Description of LR multisite cloning to generate injection constructs. C-E: Transmitted light images of embryos immunostained with an antibody against Egfp; embryos were co-injected with 25 pg of indicated Tol2 construct and 25 pg of Tol2 transposase mRNA.C: Expression of Egfp in blood vessels of the head and trunk in an embryo injected with pTol-fli1a-0.9/+5.9:egfp. D: Ectopic Egfp expression in the head and trunk in an embryo injected with pTol-fli1a+1.2/+2.2:egfp. E: Egfp expression in head vessels (arrows) and trunk vessels (arrowhead) in an embryo injected with pTol-flia+2.2/+3.2:egfp. |
|
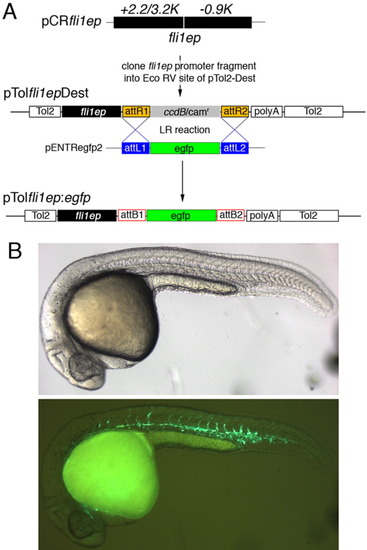
Construction and use of an endothelial Tol2 Destination vector. A: Description of the construction of a Tol2-based Destination vector for generating injection constructs to drive expression in endothelial cells. B: Embryo injected with pTolfli1ep:egfp showing robust Egfp expression throughout the trunk blood vessels at 26 hours postfertilization. |

