
- Title
-
Zebrafish Melanophilin Facilitates Melanosome Dispersion by Regulating Dynein
- Authors
- Sheets, L., Ransom, D.G., Mellgren, E.M., Johnson, S.L., and Schnapp, B.J.
- Source
- Full text @ Curr. Biol.

Characterization of Melanosome Transport in Wild-Type and j120 Zebrafish Melanocytes (A) Aggregation and dispersion in wild-type and mutant five-day-old larvae. In response to MCH, pigment appears similarly aggregated in mutant and wild-type fish. In response to MSH, melanocytes within wild-type fish disperse their pigment fully, whereas melanocytes in j120 mutant fish do not. (The scale bar represents 200 μm in main images and 50 μm in insets.) (B) Aggregation and dispersion in cultured wild-type and j120 mutant melanocytes visualized by DIC microscopy. As shown in the top row, wild-type and mutant melanocytes fully aggregate their melanosomes after 5 min in MCH. Aggregation appears normal in the mutant melanocyte. As shown in the second row, exposure to MSH for 5 min elicits complete dispersion in wild-type but only partial dispersion in mutant melanocytes. The bottom and right-hand column contains a j120 mutant melanocyte showing that during dispersion its melanosomes load on microtubules and move bidirectionally. Digital images of this melanocyte were collected over a 5 min period after the initiation of dispersion by MSH. Each preceding frame was subtracted from each new frame so that a difference image could be created, and the stack of difference images was summed through the recording period. Thus, this figure reveals the sum of what has moved during the recording period. Linear trajectories of many individual melanosomes are evident as white “beads on a string.” One of these is within the area outlined in yellow. This area is shown at higher magnification at the bottom of the column of frames to the right. The upper five frames in the column show the direct images of the moving melanosome that produced the linear trajectory in the summed difference image. This melanosome moves bidirectionally (Scale bars represent 10 μm.). (C) Fraction of cultured wild-type and j120 mutant melanocytes that respond to hormones fully or partially. Melanocyte cultures were treated for 10 min with 0.5 μM MSH or 1 μM MCH. Partial dispersion (defined as melanosomes that spread from the aggregated state but did not completely fill the melanocyte within 10 min) or no dispersion (defined as melanosomes that remained aggregated after the dispersion stimulus) was evident in a minor fraction of wild-type melanocytes. j120 homozygous mutant melanocytes were never observed to fully disperse their melanosomes (n = 96 and 75 for wild-type and mutant, respectively). (D) Kinetics of global melanosome dispersion in cultured wild-type and mutant melanocytes. Wild-type and mutant melanocytes with melanosomes aggregated were stimulated to disperse with MSH or caffeine, and the percent of the projected cell area filled with melanosomes was measured at 10 s intervals. Data points are averages from five mutant and five wild-type melanocytes. (Error bars represent SEM.) (E) Images of cultured wild-type and mutant melanocytes 5 min after applying compounds that lower or elevate intracellular cAMP levels. As shown in the first and third rows, melanocytes were first exposed to 0.1 mM epinephrine for aggregation induction. As shown in the second and fourth rows, melanocytes were then exposed to forskolin (200 μM) or sp-cAMP (30 μM). Both elicit full melanosome dispersion in the wild-type but only slow partial dispersion in the mutant. (F) Response of cultured wild-type and j120 mutant melanocytes to melanosome aggregation- and dispersion-inducing drugs applied after overnight pretreatment with the phosphatase inhibitor okadaic acid (OA). The top left contains the positive control showing that OA inhibits the phosphatase responsible for aggregation. Pretreatment of wild-type cultures with 1 μM OA inhibits aggregation induced by epinephrine. As shown in the top and bottom right images, overnight pretreatment of j120 mutant melanocytes with 1 μM OA did not rescue partial dispersion, either in Ringers (upper) or after exposure to forskolin (lower). The small expansion of melanosomes in the j120 mutant melanocyte in (F) compared to those in (E) is a side effect of the overnight exposure to okadaic acid. The main point is that forskolin does not induce further expansion to the cell periphery, as it does in wild-type melanocytes. As shown in the bottom left panel, forskolin induces full dispersion in wild-type melanocytes pre-treated with 1 μM OA. (Scale bars represent 10 μm.) PHENOTYPE:
|

Partial Dispersion in j120 Melanocytes Does Not Involve an Abnormal Microtubule or Actin Cytoskeleton and Is Independent of Actin (A) Fluorescent images of hodamine-phalloidin-labeled actin (red) and immuno-labeled α-tubulin (green) in cultured wild-type and j120 mutant melanocytes. Microtubule and actin cytoskeletons appear normal in the mutant. (B) Aggregation and dispersion of melanosomes in the absence of actin filaments. Melanocytes were treated with 5 μM latrunculin A for 15 min for disruption of actin filaments and then with caffeine for inducing dispersion. In latrunculin, wild-type melanocytes hyperdisperse their melanosomes, whereas the j120 mutant melanocyte still only partially dispersed its melanosomes. Aggregation (induced by epinephrine) is unaffected by latrunculin. Rhodamine-phalloidin staining confirms the loss of actin filaments in the latrunculin-treated melanocytes. Microtubules (green) were labeled with an antibody against α-tubulin. (Scale bars represent 10 μm.) |

Analysis of Individual Melanosome Movements during Dispersion (A) Melanosome tracks from wild-type and j120 mutant melanocytes undergoing global dispersion. Track duration is 30 s; lines connect the successive positions. Yellow squares mark the start of directed travel along microtubules; black arrows mark periods of pause or undirected movement. Shown in the inset are the DIC image and track overlay for the wild-type melanosome. (The scale bar represents 1 μm.) (B) Fraction of time melanosomes engage in the three motion states (minus-end, plus-end, or paused/undirected) during 30 s observation periods made 1.5 and 3 min after inducing dispersion. Each bar pools the data from all tracked melanosomes (Table 2) in the indicated category (e.g., wild-type, 1.5 min). The principal difference between the wild-type and mutant is that the mutant spends more time engaged in travel to the minus end. (C) Microtubule plus- and minus-end travel of wild-type and j120 melanosomes during 30 s observation intervals 1.5 and 3 min after initiating dispersion. Each bar represents the mean ± SEM over all tracked melanosomes. Travel distances are the products of the average run lengths and episode frequencies indicated in Table 2. Whereas for wild-type melanosomes plus-end travel exceeds minus-end travel, for mutant melanosomes, travel in the two directions is balanced. |

Identification of j120 as Zebrafish Melanophilin (A) Linkage of j120 to SSR markers (vertical black lines) on chromosome 6. The fractions are the observed recombination rates between the mutation and that marker. Zebrafish BAC clone BX649631 contains mlpha. (B) Intron-exon organization of the wild-type and j120 alleles of the zebrafish mlpha gene. A mutation in the j120 allele leads to abnormal splicing of exon 7, which in turn introduces a stop codon in the coding sequence. (C) Genomic DNA sequence of wild-type and j120 alleles of mlpha at the junction of intron 6 and exon 7. The mutant has an A-to-T mutation in the predicted splice acceptor site of intron 6. (D) RT-PCR analysis of mlpha exon 7 with RNA from wild-type larvae (+/+) and larvae homozygous (j120/j120) or heterozygous (+/j120) for the mlphaj120 allele. Gel electrophoresis of the PCR products corresponding to exon 7 shows that only RNA from larvae with the mutant allele yields the shorter PCR product. RNA from homozygous mutant larvae yields only the shorter fragment and not the longer one. Normal and abnormal splicing of exon 7 predict PCR products of these sizes. (E) In situ hybridization with an antisense probe against mlpha mRNA performed on wild-type and homozygous j120 mutant 2-day-old embryos. Arrows indicate expression in wild-type melanocytes. (The scale bar represents 100 μm.) (F) Knockdown of Mlpha expression in 3-day-old wild-type larvae. Wild-type embryos were injected with a morpholino antisense (middle panel) or a control oligonucleotide (top panel). Larvae that received the antisense oligonucleotide have contracted pigment, which phenocopies the appearance of pigment in j120 mutant fish (bottom panel). (Scale bars represent 200 μm in main images and represent 50 μm in insets). (G) Mosaic rescue in 5-day-old j120 mutant larvae injected at the one-cell stage with a plasmid containing Mlpha cDNA fused with GFP. Arrows indicate rescued melanocytes. As shown in insets, a GFP-Mlpha expressing melanocyte (arrow) has even dispersion of melanosomes compared to the contracted melanosomes of adjacent melanocytes (Scale Bars, from left to right, represent 100 μm, 25 μm, and 15 μm). The strong particulate fluorescence in the rescued cell suggests that melanosomes recruit GFP-Mlpha. EXPRESSION / LABELING:
PHENOTYPE:
|
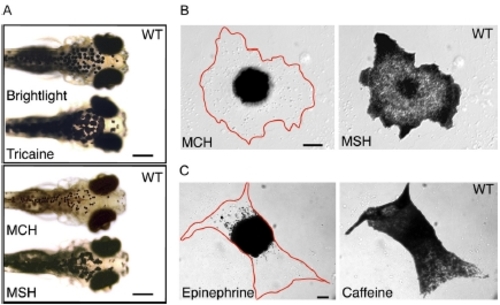
Characterization of Melanosome Transport in Wild-Type Zebrafish. Melanocyte pigment granules in five-day-old swimming larvae completely aggregate within 5 min of exposure to melanin concentrating hormone (MCH) and completely disperse within 10 min of exposure to α-melanin stimulating hormone (MSH) (shown in [A]). The drug carrier, DMSO, does not affect melanosome distribution (data not shown). We used primary cell cultures of melanocytes from wild-type larvae to confirm that the cAMP signaling pathway that regulates aggregation and dispersion in other species also directs pigment granule movements in zebrafish (shown in [B]; Table 1). |