
- Title
-
Hedgehog signaling patterns the outgrowth of unpaired skeletal appendages in zebrafish
- Authors
- Hadzhiev, Y., Lele, Z., Schindler, S., Wilson, S.W., Ahlberg, P., Straehle, U., and Mueller, F.
- Source
- Full text @ BMC Dev. Biol.
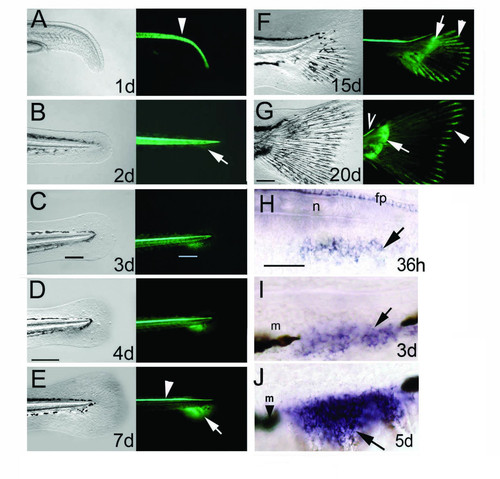
The ontogeny of the caudal and pectoral fins is marked by continuous GFP expression in the transgenic zebrafish line 2.2shh:gfp:ABC#15. A-G, The first 20 days of zebrafish caudal fin development. Bright field view of caudal fin on left panels, right panels show fluorescence signals of GFP activity. A, GFP in the notochord is shown by an arrowhead. B, GFP protein is detected from 2 days onwards in the embryonic fin fold mesenchyme. C, D, GFP expression indicates that the caudal fin mesenchyme occupies the gap of the melanophore streak at 3–4 dpf (black and white bars in C). E, GFP in the caudal fin primordium is split anteroposteriorly at 7 dpf (arrow at boundary of domains). Notochord expression is diminished, while floor plate expression remains active (arrowhead). F, G: GFP expression extends caudally and tilts dorsally indicating the formation of adult caudal fin morphology with dorsal and ventral lobes. In late larval development proximal GFP expression is present in the endoskeletal territory (arrows in F, G) and distally in the fin rays (arrowheads in F, G). GFP is expressed continually in the floor plate (open arrowhead in G). H-J, gfp mRNA expression in the ACFP is first detected at 1.5 dpf by in situ hybridization (H) then extends ventrally (arrows in I, J) between the melanophores (arrowhead with m). Age of larvae developing at 28°C is indicated in days post fertilization (d). Scale bar in D represents 200 μm (for panels A-F) and 100 μm in G. Scale bar in H represents 100 μm (H-J). Abbreviations; fp, floor plate, n, notochord, m, melanophore. EXPRESSION / LABELING:
|

The proximal GFP domain in the ACFP is independent of the fin rays and marks endoskeletal structures. Proximal GFP labeling the ACFP and its derivates (arrowheads in A, B) is only observed in one transgenic line (#15) out of 29 lines produced (compare areas with arrowheads in A to C and B to D), while GFP activity in the distal fin rays is present in several transgenic lines containing the shh regulatory elements (arrows in B, D) mimicking endogenous shh expression of the fin ray tips [21]. E-G, Proximal GFP in ACFP (arrowhead) and distal GFP domains in the fin ray tips (arrow) are physically separated during ossificiation of fin rays. Fluorescent view (E), bright field view (F) and overlay of E and F (G) of caudal fins of 12 dpf larva of transgenic line #15. F, ossification of fin rays (fr, arrow) is detected by alizarin red staining. H-J, GFP is detected in the perichondrium (arrowhead) around, but not in the endoskeletal cartilage of the hypurals marked by alcian blue staining (arrowhead). H, fluorescent view, I, bright field view, J, overlay of H and I of 14 dpf larva (5.5 mm notochord length). Red bars indicate plane of cross sections inserted in H-J. Scale bar in I indicates 120 μm (H-J). Abbreviations: fp, floor plate, n, notochord, hspu, hemal spine, phy, parhypural, hy, hypural, fr, fin ray, m, melanophore. Anatomical structures were identified as described in [19]. EXPRESSION / LABELING:
|

Hh signaling components but not shh are expressed in adult caudal fin primordium. Expression of gfp in caudal fin primordium at 3 dpf (A, arrow) overlaps with smu (B, arrow) gli3 (C, arrow) and you expression (D arrow). E, No shh expression is detected in the fin fold mesenchyme (arrow) while a weak residual activity in notochord is detected (open arrowhead). Expression of gfp and shh overlap in the floor plate (compare A to E, arrowheads). F-G, Expression of gfp is lacking in the posterior pectoral fin (arrow, F) where shh is expressed (arrow in G). Tail regions of 72 hpf embryos are shown anterior to the left in A-E and isolated pectoral fin buds of 60 h embryos are shown distal to the top posterior to the left in F, G. Scale bar in F represents 100 μm (A-B), 80 μm (C-E) and 40 μm (F, G). H, I, microsurgical preparation of fin fold tissues from 3 dpf zebrafish larvae for RT PCR analysis. H, ACFP tissue was cut by scalpel as indicated by green rectangular area (ACFP). Dorsal fin fold tissue containing notochord and neural tube with floor plate was excised similarly (red rectangular area, DFF). I, ACFP tissue after excision. Right panels show bright field view, left panels are fluorescent views of caudal fin tissues. J, RT PCR analysis of gene expression in the ACFP and DFF tissue samples. Gfp and smu but not shh are expressed in the ACFP. K, Real time PCR analysis of hedgehog genes in the ACFP and DFF. No known hedgehog genes are expressed in the ACFP. Agarose gel electrophoresis of PCR products in 40 cycles is shown on the left. Ct values of real time PCR cycles are shown on the right. L, Expression of hedgehog genes in the caudal fin of zebrafish during development. Agarose gel electrophoresis of real time PCR after 40 cycles on whole caudal fin fold and caudal fin samples are shown. Abbreviations: A, ACFP, D, DFF, d, days post fertilization, gfpn and neg c: gfp negative controls, ND, no specific product detected. EXPRESSION / LABELING:
|
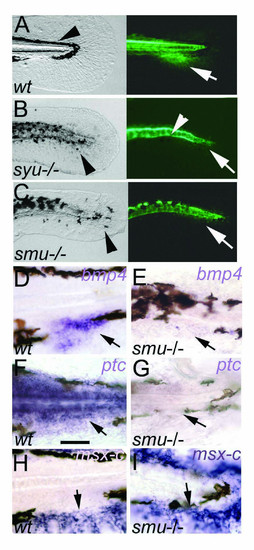
Hedgehog signaling is required for the patterning of the caudal fin. A-C: caudal fin primordium development is blocked in syu-/- and smu-/- mutants. A, Wild type embryo tail showing normal embryonic fin fold and melanophore streak (arrowhead) in bright field (left) and GFP fluorescence (right) marking the adult caudal fin primordium (arrow). B, C, In syu-/- and smu-/- mutants gfp expression in the fin fold is absent (arrows). The melanophores are abnormally arranged (arrowheads in left). Expression of GFP in the floor plate and residual activity in the notochord is present (arrowhead in B, right). D-I, Hedgehog signaling regulates gene expression in the caudal fin primoridum. Expression of bmp4 (arrows in D, E) and ptc (arrows in F, G) are lost or strongly reduced in smu-/-. In contrast, the mesenchyme marker msx-C is expressed in the embryonic fin fold in wild type (H, arrow) and in smu-/- mutants (I, arrow). Lateral views on embryonic tail region of 72 hpf embryos are shown. Scale bar in F indicates 100 μm. EXPRESSION / LABELING:
PHENOTYPE:
|

Continual and direct requirement for Hedgehog signaling in caudal fin development. A-D, Schematic representation of the time span of the experiment (black stripe), cyclopamine treatment (red stripe) and time of analysis of embryos (green arrow) are shown on the left. Tail of zebrafish embryos at the time of analysis are shown on the right. Bright field (top panels in A) and fluorescence signals (lower panel in A and B-D) of representative samples of zebrafish embryos are shown. A, No GFP expression in the fin fold mesenchyme in cyclopamine treated embryos (cyclop, arrow) in comparison to control ethanol treated embryos (EtOH, arrow). B-D: Cyclopamine treatment from 24 to 48 h results in reduction of GFP expression. E-M: Cell autonomous and non-autonomous requirement for smu in development of caudal fin primordium. E-G: transplantation of wild type transgenic cells targeted in the ACFP results in donor cells in the fin fold mesenchyme (arrows in F) with activated GFP (arrows in E, G). H-J: Transplantation of smu-/- transgenic cells into wild type embryos results in rhodamine labeled cells in the fin fold mesenchyme (arrow in I) but these cells do not express GFP (arrows in H, J). K: smu-/- transgenic cells in the floor plate activate gfp expression (arrow). L, M: Transplantation of wt transgenic cells into smu-/- non-transgenic embryos results in rhodamine labeled cells excluded from the fin fold mesenchyme (arrows). Tail region of 72 hpf embryos are shown anterior to the left. Abbreviation: n, notochord. |
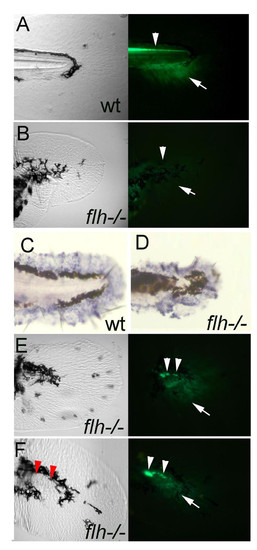
A functional midline with expression of shh is required for the ACFP. A, B, GFP expression domains including that in the floor plate indicating shh expression (arrowhead) and the ACFP marker (arrow) are present in wild type (A) and lost in flh/- embryos (B). C, D, The fin fold mesenchyme as indicated by msx-c expression is unaffected in flh-/- embryos. The ragged appearance of the fin fold is due to shrinkage during the whole mount in situ hybridization procedure. E, F, presence of residual floor plate cells (arrowheads) are coupled with rescue of the ACFP (arrows). Red arrowheads in F indicate the position of floor plate cells as detected in the fluorescent image. All images of caudal fin regions anterior to the left. Bright field views are shown on the left panels and fluorescence images using GFP filter on the right (A, B, E, F). EXPRESSION / LABELING:
PHENOTYPE:
|
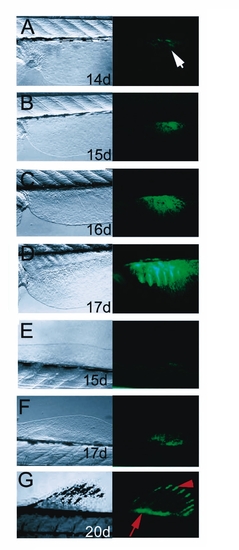
Development of dorsal and anal median fins of the zebrafish. Left side panels show bright field view of dorsal fin, right panels show fluorescence signals of GFP activity. A-D: Ontogeny of the dorsal fin is marked by GFP activity. First signal is observable at 14 dpf. E, G: Development of the anal fin. GFP activity is first detected at 15 dpf. The GFP territory expands and splits into domains of the endoskeletal mesenchyme (arrow in G) and the fin ray tip (arrowhead in G) similarly to the caudal fin. H-K: Proximal expression of GFP in differentiating caudal fin primordium (arrowheads in H, I) is only observed in transgenic line #15, but not in line #24 (arrowheads in J, K), while GFP activity in the distal fin rays is present in several transgenic lines containing the shh regulatory elements (arrows in I, K) mimicking endogenous shh expression of the fin rays [21]. Age of larvae is indicated in days post fertilization (d). EXPRESSION / LABELING:
|

GFP marks pectoral fin development. A, B: GFP marks the distal tip of the fin bud from 40 hpf onwards (arrow in A). Bright field view on the left, and fluorescence in the right. B, At 5 dpf GFPexpression is restricted to dorsal half of the mesenchyme disc (arrowheads). Bright field view on the left and fluorescence on the right are shown. C, Expression of GFP is also present in the developing fin rays at 16 dpf (arrowhead). Age of larvae developing at 28°C are indicated in days post fertilization (d). EXPRESSION / LABELING:
|
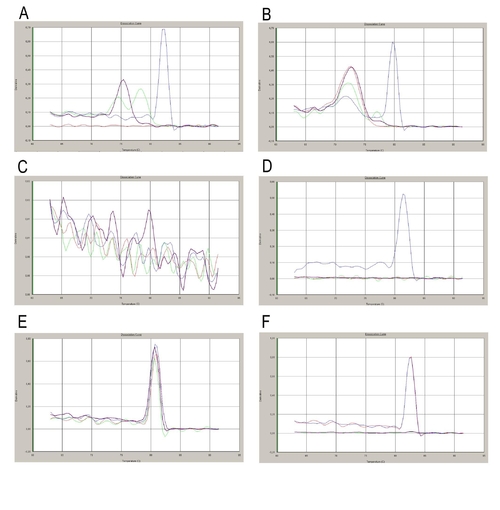
Dissociation curves of the products from the RT-PCR shown on Fig 3J. The red and blue curves represent the dissociation of the products from ACFP and DFF samples respectively. The green and purple curves show the dissociation of the non-template (primer) controls. Specific products of shh shhb and ihhb (panel A, B and D) have been detected only in the DFF samples, but not in the ACFP. The presence of ihha (panel C) was not detectable either in the ACFP or in the DFF samples. The presence of gfp and beta-actin (panel E and F, respectively) were detectable in both, ACFP and DDF samples. In case of gfp, dissociation curves of the primer controls are very similar to that of the PCR product, due to primer dimmers, however no amplification was observed on the amplification plots (data not shown). |
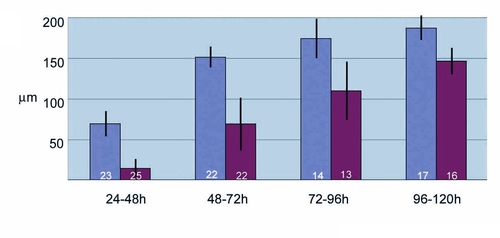
Cyclopamine treatment results in reduction of the GFP expression domain in the ACFP. Average width of GFP expression domain measured from the bottom of notochord in μm is shown with standard deviation. Time of cyclopamine exposure from fertilization in hours (h) is indicated. Blue bars represent 2% ethanol treated controls, bars in purple represent cyclopamine treated embryos. Number of embryos analyzed is indicated at the base of the bars. |