
- Title
-
Jagged2a-notch signaling mediates cell fate choice in the zebrafish pronephric duct
- Authors
- Ma, M., and Jiang, Y.J.
- Source
- Full text @ PLoS Genet.

Multi-Cilia Cells and Principal Cells Interpolate in the Pronephric Duct Embryo in (A) is 48 hpf, embryos in (O–Q) are 27 hpf, and all others are 36 hpf. (A) Acetylated tubulin staining revealed that cilia tufts are located in the lumen of the distal (demarcated by arrowheads) but not proximal pronephric duct (ppd) or cloaca (cl). Arrows point to the ventral axons of caudal primary motor neurons (CaP), which project approximately midway within each somite [94]. nt, neural tube. (B–D) Antibody staining of (B) acetylated tubulin, (C) Pcm1, and (D) merged image revealed that multiple basal bodies associate with each cilia tuft. (E) Antibody staining of acetylated tubulin (green) and Pcm1 (red) on transverse section of pronephric duct (counter-stained with WGA [blue]) revealed that the cilia tuft is within the lumen and there are multiple basal bodies within one cell. Arrows mark the cell membrane and arrowheads point to the individual Pcm1 staining in the neighboring cells. (F) Antibody staining of Pcm1 (green) and Zo-1 (red) on a transverse section of the pronephric duct revealed that multiple basal bodies are localized to the apical side of one cell. Arrows point to the Zo-1 staining. (G) Transmission electron microscope view of the lumen revealed that the cilia tuft contains at least 15 cilia in a closely organized manner and that individual primary cilia are present (arrows), all with the typical 9 + 2 structure (insert). Green lines demarcate cell borders. (H–K) Whole-mount (H, I, and K) and transverse section (J) in situ staining of sodium pump genes (H–J) Na+, K+ ATPase α1a2 and (K) Na+, K+ ATPase β1a revealed that these genes are not expressed in some individual cells (demarcated by yellow dotted lines). (I) Magnified image of the box in (H). (L and M) Whole-mount (L) and transverse section (M) in situ staining of rfx2 revealed that rfx2 is expressed in individual cells. The red dotted line in (M) outlines the duct. (N) Whole-mount in situ staining of centrin2 revealed that centrin2 is expressed in the individual cells; the insert on the top is a magnified image of the box below. (O–Q) Fluorescent double in situ staining revealed that (O) rfx2 and (P) Na+, K+ ATPase β1a are expressed in different cells. Arrows point to the cells that do not express Na+, K+ ATPase β1a. (Q) Merged image of (O) and (P); perceived costaining of rfx2 and Na+, K+ ATPase β1a in some cells of the duct is an artifact caused by viewing at a single angle. Bar scale: 100 μm (A [bar in (D)]), 10 μm (B–D [bar in (D)], E, and F), 1 μm (G), 100 μm (H), 25 μm (I–K, [bar in (H)]), 70 μm (L), 25 μm (M, [bar in (L)]), 100 μm (N), 50 μm (O–Q [bar in (Q)]). EXPRESSION / LABELING:
|
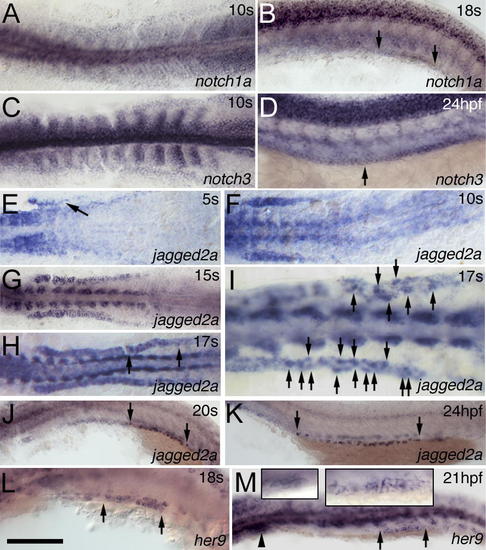
Dynamic Expression of Notch Components in the IM and Pronephric Duct(A–D) notch1a (A) and notch3 (C) are expressed in the IM at 10 ss. notch1a (B) is expressed in the distal duct region from somite 10 to 14 (see also Figure S3B) at 18 ss, and notch3 (D) is expressed in the whole duct from somite 3 to 20 at 24 hpf as indicated by the arrows. (E–G) jagged2a expression in the IM appears gradually from anterior to posterior from 5 ss (E) (as indicated by the arrow) to 10 ss (F), and reaches the posterior by 15 ss (G). (H–K) jagged2a expression is higher in some cells (arrows point to these cells in [I], which is magnified from [H]) than in neighboring cells in the distal duct at 17 ss (H and I), and transcription is limited to individual cells from 20 ss (J), to 24 hpf (K), to at least 36 hpf (unpublished data) in the demarcated region from somite 8 to 14 (see also Figure S3D and S3F) as indicated by arrows. (L and M) her9 is expressed in the distal pronephric duct at 18 ss (L) from somite 10 to 12 (Figure S3H) and at 21 hpf (M). The arrowhead marks the glomerulus, and arrows demarcate the her9 expression region. Left and right inserts in (M) are the magnified images in the glomerulus and distal duct, respectively. All embryos, anterior to the left. (A), (C), and (E–I) are dorsal views; the rest are lateral views. Bar scale: 200 μm (A, C, and E), 110 μm (B and D), 180 μm (F), 230 μm (G and H), 90 μm (I), 115 μm (J), 190 μm (K), and 100 μm (L and M). EXPRESSION / LABELING:
|

jagged2a-Expressing Cells in the Pronephric Duct are Multi-Cilia Cells(A–D) rfx2 is expressed uniformly in the IM at (A) 15 ss, and expression is restricted to individual cells in the pronephric duct from (B) 17 ss onwards to (C) 20 ss and (D) 24 hpf. Arrows demarcate the distal duct region that contains rfx2-expressing cells. (E–J) Fluorescent double in situ hybridization of (E and H) jagged2a and (F and I) rfx2 revealed that they are (G and J) colocalized in the distal pronephric duct of (E–G) 17-ss and (H–J) 22-hpf embryos. Arrows point to the cells that express jagged2a and rfx2, and arrowhead points to the cells that express jagged2a only. (K–M) Fluorescent double in situ hybridization of (K) rfx2 and (L) her9 revealed that they are expressed in the (M) alternate cells in the distal pronephric duct of 20-ss embryos. Arrowheads point to the rfx2-expressing cells and arrows point to the her9-expressing cells. All embryos, anterior to the left. (A) and (B) are dorsal views; (C–M) are lateral views. Bar scale: 135 μm (A), 150 μm (B), 100 μm (C), 120 μm (D), and 50 μm (E–M). EXPRESSION / LABELING:
|

Multi-Cilia Cell Hyperplasia Is Due to Mib-Mediated Jagged2a Signaling Pathway via Notch1a and Notch3 Receptors(A) Effectiveness of splicing jagged2a-sp MO. RT-PCR of control embryos generates a 230-bp jagged2a fragment, bridging parts of exon 1 and exon 2 at 24 hpf (lane 1) and 48 hpf (lane 5). jagged2a-sp MO-injected embryos analyzed with the same primers at the same timepoints (lanes 3 and 7) show a larger amplicon of 708 bp caused by a nonsplicing intron 1, which encodes a premature stop codon. Lane 9 shows the amplicon from genomic DNA, and lane 10 shows the amplicon from jagged2a cDNA. No fragment can be amplified in the RT-PCR without reverse transcriptase in 24-hpf (lane 2) or 48-hpf (lane 6) wt embryos or in 24-hpf (lane 4) or 48-hpf (lane 8) jagged2a-sp MO-injected embryos. Lane L: 100-bp ladder. (B) Pronephric duct (arrow) integrity is not affected in jagged2a morphants. Panels C–L focus on the duct between somite 10 and 13. (C–H) Multi-cilia cell number is increased in (D and F) jagged2a-atg morphants compared to (C and E) wt embryos as shown by (C and D) rfx2 and (E and F) centrin2 expression at 24 hpf, but principal cell number is decreased in (H) jagged2a-atg morphants compared to (G) wt embryos as revealed by Na+, K+ ATPase β1a expression at 24 hpf. (I–L) Multi-cilia cell number is increased in (J) mibta52b embryos compared to (I) wt embryos as shown by rfx2 expression at 24 hpf, but principal cell number is decreased in (L) mibta52b embryos compared to (K) wt embryos as revealed by Na+, K+ ATPase α1a2 expression at 24 hpf. Panels M–R focus on the duct around somite 11 to 13. (M–O) Fluorescent double in situ hybridization of rfx2 (green) and Na+, K+ ATPase β1a (red) in 36-hpf (M) wt embryos, (N) jagged2a-sp morphants, and (O) mibta52b mutants shows multi-cilia cell hyperplasia in jagged2a morphants and mibta52b mutants. Arrows point to the rfx2-expressing cells in the duct of (M) wt embryos; arrowheads point to the Na+, K+ ATPase β1a-expressing cells in the pronephric duct of (N) jagged2a-sp morphants. (P–R) Double immunohistochemistry of α6F (green) and Pcm1 (red) in 36-hpf (P) wt embryos, (Q) jagged2a-sp morphants, and (R) mibta52b mutants shows multi-cilia cell hyperplasia in jagged2a morphants and mibta52b mutants. Arrows point to the Pcm1 staining in the pronephric duct of (P) wt embryos; arrowheads point to α6F staining in the pronephric duct of (Q) jagged2a-sp morphants. (S) Immunoprecipitation of Myc-Jagged2a and Myc-Jagged2aicd by Flag-Mibta52b. IP, immunoprecipitation; IB, immunoblotting. (T–U) Expression of Myc-Jagged2a (T) and cotransfection of Myc-Jagged2a and Flag-Mib (U) in COS7 cells. (V–Y) Compared to (V) wt embryos, mild cilia cell hyperplasia is observed in (W) notch1a (desth35b) mutants and (X) notch3-utr morphants, while severe cilia cell hyperplasia is observed in (Y) notch3-utr MO-injected notch1a (desth35b) mutants as shown by rfx2 expression at 24 hpf. All embryos, anterior to the left. Bar scale: 100 μm (B), 75 μm (C–L and V–Y), 50 μm (M–R), and 30 μm (T and U). |

her9 is a Downstream Target Gene of Jagged2a-Notch1a/Notch3 Signaling(A and B) Compared to (A) wt embryos, her9 expression in the pronephric duct region at 18 ss is severely down-regulated in (B) jagged2a-sp morphants. (C–F) Compared to (C) wt embryos, her9 expression in the pronephric duct region at 17 ss is mildly down-regulated in (D) notch1a (desth35b) mutants and (E) notch3-sp morphants, and is severely down-regulated in (F) notch3-sp MO-injected notch1a (desth35b) mutants. (G and H) Compared to (G) wt embryos, her9 expression in the pronephric duct region at 18 ss is severely down-regulated in (H) mibta52b mutants. (I and J) Coinjection of GFP mRNA (50 pg) and notch1aicd mRNA (100 pg) into one blastomere at the two-cell stage leads to (I) somite boundary disruption in the right half of the embryo, while somites on the left side are segmented properly. (J) GFP expression demonstrates that mRNA is localized to the right half of the embryo. (K) Compared to the left side of the embryo, her9 expression in the duct (arrows) and glomerulus (arrowheads) is increased in the right side at 18 ss. (L and M) Compared to (L) wt embryos, the multi-cilia cell number is increased in (M) her9-utr morphants as shown by rfx2 expression at 24 hpf. All embryos, anterior to the left. (A–K) are dorsal views; (L and M) are lateral views. Bar scale: 100 μm (A–J), 130 μm (K), and 50 μm (L and M). EXPRESSION / LABELING:
|

bMulti-Cilia Cells Start to Differentiate as a Result of Jagged2a-Notch Signaling from 17 ss Onwards(A–C) rfx2 expression in (A) wt embryos, (B) mibta52b mutants, and (C) jagged2a-sp morphants at 15 ss. (D–F) rfx2 expression in (D) wt embryos, (E) mibta52b mutants, and (F) jagged2a-sp morphants at 18 ss. Arrows point to the rfx2 expression in the (A–C) IM and (D–F) pronephric duct. rfx2 staining in the neural tube (arrowheads) indicates the neurogenic phenotype in (B and E) mibta52b mutants compared to that of (A and D) wt embryos. All embryos, anterior to the left. (A–C) are dorsal views; (D–F) are lateral views. Bar scale: 200 μm (A–C) and 100 μm (D–F). EXPRESSION / LABELING:
|

Notch-Dependent Binary Choice between Multi-Cilia cells and Principal Cells in the Pronephric Duct(A–D) double antibody staining of Pax2a (red) and phospho-histone-3 (pH3, green) of 18 ss (A and B) wt embryos and (C and D) mibta52b mutants. In (A) and (C), some pH3-positive nuclei seem to overlap with Pax2a-positive nuclei in the pronephric duct (arrows and arrowheads). Higher magnification of the distal duct domain marked by the white box of the same (B) wt embryo and (D) mibta52b mutant revealed that the pH3-positive nuclei indicated by arrowheads are not found in pronephric duct, while the nuclei indicated by arrows are overlapping with Pax2a-positive nuclei. A 3-D reconstruction of the domain revealed that the nuclei are not overlapping with Pax2a-positive nuclei (Videos S1 and S2). Pax2a staining in the neural tube (asterisk) indicates the neurogenic phenotype in (C) mibta52b mutants compared to that of (A) wt embryos. Three wt embryos and four mibta52b mutants were examined. In addition, three wt embryos and three mibta52b mutants were sectioned, and all sectioned slices were examined. No proliferating cells were found in the duct domain (unpublished data). (E and F) Apoptosis assay with TUNEL method on (E) wt embryos and (F) mibta52b mutants at 21 hpf. TUNEL staining was found in the somite and neural tube (arrowheads), while TUNEL staining was not found in the pronephric duct (arrows). The brown staining in the duct is background staining. Ten wt embryos and five mibta52b mutants were examined. (G and H) Fluorescent double in situ hybridization of rfx2 (red) and Na+, K+ ATPase β1a (green) in 24-hpf embryos demonstrated that multi-cilia cells interpolate principal cells in (G) heat-shocked hsp70:Gal4 control embryos, while in (H) heat-shocked hsp70:Gal4/UAS:myc-notch1a-intra embryos, Na+, K+ ATPase β1a expression is robustly found in the duct cells but rfx2 is not. Arrows point to rfx2-expressing cells. (A–D) are anterior to the right; (E–H) are anterior to the left. Bar scale: 100 μm (A and C), 50 μm (B and D), 100 μm (E and F), and 50 μm (G and H). |

notch1a, jagged2a, and her9 Are Expressed in the Distal Duct at the Time of Cell-Fate Determination (A and B) Fluorescent double in situ hybridization of notch1a and myoD [93] revealed that notch1a is expressed in the pronephric duct spanning from somite 10 to 14 (arrows) at 18 ss. (C and D) Fluorescent double in situ hybridization of jagged2a and myoD revealed that mosaic jagged2a expression is found in the pronephric duct spanning from somite 8 to 14 (arrows) at 22 ss. (E and F) Fluorescent double in situ hybridization of jagged2a and myoD revealed that jagged2a-expressing single cells are found in the pronephric duct spanning from somite 8 to 14 (arrows) at 24 hpf. (G and H) Fluorescent double in situ hybridization of her9 and myoD revealed that her9 is expressed in the pronephric duct spanning from somite 10 to 12 (arrows) at 18 ss. (I and J) Fluorescent double in situ hybridization of jagged2a (green), slc4a2/ae2 (red, anterior), and ret1 (red, posterior) revealed that jagged2a-expressing single cells are found in the distal duct between the proximal duct (marked by slc4a2/ae2; [27]) and the cloaca (marked by ret1; [11]). Small arrows demarcate the jagged2a-expressing single cell domain, arrowheads demarcate the slc4a2/ae2-expressing domain, and big arrows demarcate the ret1-expressing domain. EXPRESSION / LABELING:
|
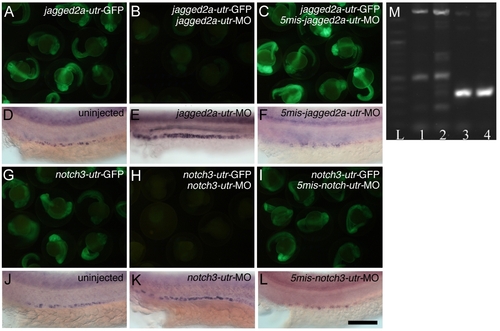
Specificity of jagged2a-utr and notch3-utr Morpholinos on Targeting the 5′ UTR of jagged2a and notch3 and the Effectiveness of the notch3-sp Splicing Morpholino (A–C) Specificity of the jagged2a morpholino. (A) Injection of jagged2a-utr-GFP mRNA at 250 pg produced green fluorescence, (B) coinjection of 0.29 pM jagged2a-utr-MO with 250 pg of jagged2a-utr-GFP mRNA inhibited GFP production, and (C) coinjection of 0.29 pM 5mis-match-jagged2a-utr-MO with 250 pg of jagged2a-utr-GFP mRNA did not inhibit its production. (D–F) Multi-cilia cell probed with rfx2 at 24 hpf in (D) wt embryos, (E) jagged2a-utr morphants, and (F) 5mis-match-jagged2a-utr morphants. Note that the number of multi-cilia cells was increased in jagged2a-utr morphants (Table 1, 93%, n = 231) but not in 5mis-match-jagged2a-utr morphants (97%, n = 35). (G–I) Specificity of the notch3 morpholino. (G) Injection of notch3-utr-GFP mRNA at 250 pg produced green fluorescence, (H) coinjection of 0.38 pM notch3-utr-MO with 250 pg of notch3-utr-GFP inhibited GFP production, and (I) coinjection of 0.38 pM 5mis-match-notch3-utr-MO with 250 pg of notch3-utr-GFP did not inhibit its production. (J–L) Multi-cilia cells probed with rfx2 at 24 hpf in (J) wt embryos, (K) notch3-utr morphants, and (L) 5mis-match-notch3-utr morphants. Note that the number of multi-cilia cells was increased in notch3-utr morphants (Table 1, 97%, n = 33) but not in 5mis-match-notch3-utr morphants (100%, n = 30). (M) Molecular analysis of the effectiveness of the notch3-sp splicing morpholino. RT-PCR of ten embryos generates a 320-bp notch3 fragment in control embryos, bridging part of exon 1 to part of exon 2 at 24 hpf (lane 3) and 48 hpf (lane 4). notch3-sp morpholino-injected embryos analyzed with the same primer sets at 24 hpf (lane 1) and 48 hpf (lane 2) show a larger amplicon of 1,800 bp caused by a nonsplicing of intron 1 and other aberrant splicing variants. Lane L: 100-bp ladder. Bar scale: 1,000 μm (A–C and G–I) and 100 μm (D–F and J–L). EXPRESSION / LABELING:
|