
- Title
-
Gene Duplication of the zebrafish kit ligand and partitioning of melanocyte development functions to kit ligand a
- Authors
- Hultman, K.A., Bahary, N., Zon, L.I., and Johnson, S.L.
- Source
- Full text @ PLoS Genet.

kitla and kitlb Whole Mount In Situ Hybridizations(A–F) kitla mRNA expression during stages of migration. (A) kitla expression is first seen at 19 hpf in the presomitic mesoderm of the tail bud (black arrowhead). (B) Section of 19-hpf tail bud. (C) High magnification shows expression of kitla mRNA in the pineal gland at 26 hpf. (D) High magnification shows kitla mRNA in the ear at 26 hpf in the sensory epithelium, with pronounced staining in the ventral otic vesicle (black arrowhead). (E) kitla mRNA is expressed in groups of cells at the horizontal myoseptum in the middle of each somite (black arrowheads) in the trunk beginning at 22 hpf through 30 hpf (image is 26 hpf). We also observe kitla-positive cells in more dorsal locations in the posterior somites (red arrowheads). (F) Cross section of trunk shows expression near notochord at 26 hpf. (G and H) kitlb mRNA expression during stages of migration. kitlb is expressed in the ventricles of the brain (black arrowheads), in the ear (red arrow), and in the cardinal vein plexus (red arrowhead) at 24 hpf (G). Cross section of brain ventricle shows kitlb expressed in cells lining the brain ventricles (H). (I and J) kitla and kitlb mRNA expression at 4 dpf, during stage of kita-dependent survival. kitla mRNA is expressed throughout the skin (black arrowhead) and in the dorsal myotome (red arrowhead) (I). kitlb mRNA is expressed faintly in the skin (black arrowhead) (J). Scale bars: (A) 100 μm, (B) 25 μm, (C) 100 μm, (D) 50 μm, (E) 100 μm, (F) 25 μm, (G) 100 μm, (H) 10 μm, (I) 25 μm, and (J) 25 μm. nt, neural tube; nc, notochord; pm, presomitic mesoderm EXPRESSION / LABELING:
|

kitla Morphant Phenocopies kitab5 Migration (A) Wild-type embryonic pigment pattern at 2 dpf shows melanocytes migrating over the yolk (red arrowhead). (B) kitab5 mutants show migration phenotype, with melanocytes remaining near ear (red arrow) and dorsum and absent on yolk and head (black arrowheads). (C) Wild-type embryos injected with kitla MOs (6.1 ng) exhibit migratory phenotype similar to kitab5 with melanocytes present near the ear (red arrow) and absent at the head and yolk (black arrowheads). (D) Wild-type embryos injected with kitlb MOs (6.0 ng) are indistinguishable from wild-type showing melanocytes present over the yolk (red arrowhead) by 2 dpf. (E–G) RT-PCR of morphant embryos shows MO specificity: (E) kitla RT-PCR of wild-type, kitla MO, and kitlb MO at 3 dpf; (F) kitlb RT-PCR of wild-type, kitla MO, and kitlb MO at 3 dpf; and (G) kitla RT-PCR of kitla MO at 2, 3, 4, 5, 6, and 7 dpf, revealing that aberrant splice product caused by the MO is dominant until 5 dpf, when wild-type message is visible. (H) Regions in embryo that were used to define migrated and nonmigrated melanocytes for quantitative analysis of melanocyte migration. Red areas indicate nonmigrated melanocytes in the dorsal and lateral stripe above the hind yolk and behind the ear. Green areas define migrated melanocytes on the head, on the yolk, and in the ventral and yolk sac stripe of the hind yolk. Note that melanocytes that have migrated to positions between the dorsum and the horizontal myoseptum, a region with typically no melanocytes, would be scored as nonmigrated in the embryo, while any melanocyte that migrates past the horizontal myoseptum would be scored as migrated, whether its migration is appropriate or not. (I) Quantitative analysis for melanocyte migration of negative control MOs (6.8 ng), kitab5, and kitla MO (6.1 ng). kitla MO embryos display a similar loss of migration as kitab5. Mean values with 95% confidence interval are reported, n = 10. Scale bars: 150 μm. PHENOTYPE:
|
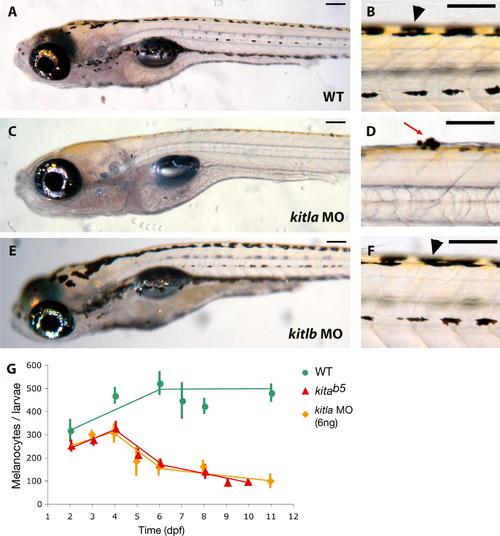
kitla Morphant Phenocopies kitab5 Survival Phenotype (A) Wild-type larva at 8 dpf. (B) Higher magnification of dorsal melanocyte stripe of 8 dpf wild-type larva with healthy melanocytes (black arrowhead). (C) kitla MO shows fewer melanocytes at 8 dpf, similar to kitab5. (D) Higher magnification of kitla MO showing melanocytes blebbing through the skin (red arrow), characteristic of melanocyte programmed cell death. (E and F) kitlb MO at 8 dpf (E) and higher magnification (F) of kitlb MO 8 dpf, which is indistinguishable from wild-type. (G) Total melanocyte counts show that the survival phenotypes of kitab5 and kitla MO are similar. Scale bars: 100 μm. |

kitla MO Enhances Temperature-Sensitive kitj1e99 Allele (A) kitj1e99 embryos reared at 28 °C appear similar to wild-type melanocyte pattern (see Figure 4A for wild-type) at 3 dpf. (B) A submaximal dose (0.5 to 0.8 ng) of kitla MOs shows little effect in wild-type embryos. (C) Submaximal dose of kitla MOs shows a significant migration phenotype in kitj1e99. (D and E) Quantitative analysis of kitj1e99–kitla enhancement. Melanocytes were counted at 3 dpf and scored as migrated if in green regions or nonmigrated if in regions shown in red (Figure 4H). Mean values with 95% confidence interval are reported (n = 10). (D) Using this metric, wild-type embryos average 94.4 (69% of total) migrating melanocytes. A submaximal dose of kitla MOs results in 16.4 fewer migrated melanocytes than wild-type. kitj1e99 embryos reared at 28 °C have 3.7 fewer migrated melanocytes. Neither the number of total melanocytes or of migrating melanocytes in kitj1e99 nor the submaximal dose of kitla MOs is significantly different compared with wild-type. (E) Migration effect is defined as the difference in migrating melaocytes compared to wild-type. If the combined effects of kitj1e99 and the submaximal dose of kitla MOs are additive, we expect a migration effect of -20.1 in the kitj1e99–kitla MO larvae (-16.4 ± 3.7). Instead, we observe a migration effect of -40.7. The χ2 test between the number of migrated melanocytes in the kitj1e99–kitla MO larvae and the expected number reveals this difference to be significantly (p < 0.0002) greater than additive. Scale bars: 150 μm. PHENOTYPE:
|
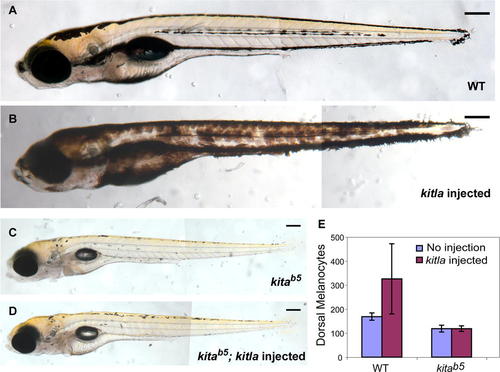
kitla Overexpression Causes Hyperpigmentation in Wild-type but Not in kitab5 Embryos (A) Wild-type larva. (B) Larva injected with kitla::JRed fusion construct shows hyperpigmentation with melanocytes covering a larger area than wild-type. (C) kita larva. (D) kitla::JRed injected into kitb5 embryos results in kitb5 phenotype. (E) kitla::JRed hyperpigmented larvae have more melanocytes on the dorsal stripe than do wild-type. When kitla expression vector is injected into kita embryos, there is no change in the number of melanocytes. All larvae at 6 dpf (n = 10). Scale bars: 150 μm. PHENOTYPE:
|