
- Title
-
Expression of rasgef1b in zebrafish
- Authors
- Epting, D., Vorwerk, S., Hageman, A., and Meyer, D.
- Source
- Full text @ Gene Expr. Patterns
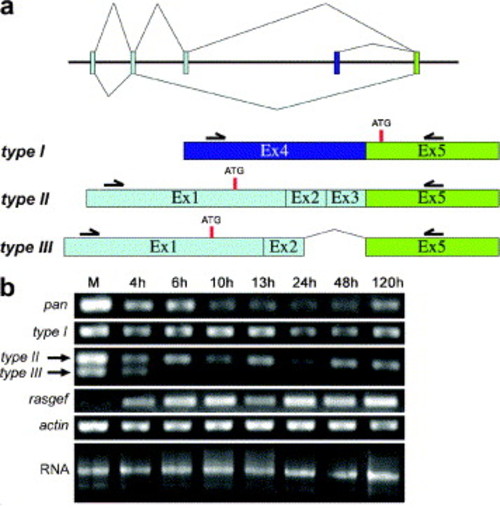
Regulation of three rasgef1b isoforms and rasgef during zebrafish development. (a) Exon structure and splicing scheme of three rasgef1b isoforms, referred as type I, type II and type III. The core domain of all three isoforms consists of exons 5–17 (only exon 5 is shown). Position of primer pairs used for amplification of the different isoforms and the start codons (ATG) are indicated. (b) Semi-quantitative reverse transcriptase PCR analysis of rasgef and rasgef1b transcripts in oocytes (maternal, M) and embryos between 4 and 120 hpf. Amplification products correspond to rasgef1b cDNA of exons 7–11 (pan), exons 4, 5 (type I), exons 1, 2, 3, and 5 (type II) and exons 1, 2, 5 (type III). Loading controls show mRNA (RNA) and RT-PCR amplification of actin cDNA (actin). Note that rasgef1b-type I and -type II show constant expression from oogenesis until 120 hpf while expression of rasgef1b-type III decreases over time. |
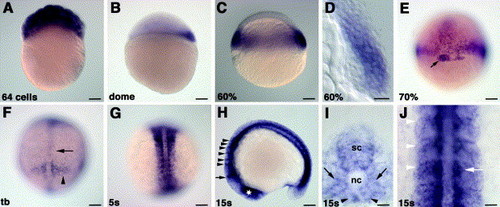
Expression of rasgef1b during early embryogenesis. (A) Ubiquitous distribution of maternal transcripts at 64-cell stage. (B) At dome stage, expression is restricted to dorsal marginal blastomeres. (C) At 60% epiboly stage, rasgef1b is expressed in the germring showing a gradient of expression with highest levels on the dorsal side (dorsal to the right). A cross section of the shield region (D) reveals expression in the epiblast. (E) At 70% epiboly, rasgef1b transcripts are detectable in the forerunner cells (black arrow). (F) At tailbud stage (tb), rasgef1b is expressed in axial mesoderm (black arrow) and in the presomitic mesoderm (black arrowhead). (G) At the 5-somite stage, expression is strongest in adaxial cells and forming somites. (H) At 15-somite stage, rasgef1b is expressed in the region of the diencephalon (asterisk), the MHB (black arrow) and in the hindbrain (black arrowheads). Cross section (I) shows that rasgef1b is not expressed in the notochord (nc) but in all tissues surrounding the notochord. Indicated are adaxial cells (black arrows), ventral mesendoderm (black arrowheads) and spinal cord (sc). The dorsal view (J) shows that the expression in adaxial cells is arranged in clusters (white arrow), and somitic expression is strongest in the anterior part of the somite (white arrowheads). Embryos are shown from lateral (A–C and H) or dorsal (E–G) with anterior to the left (H) or anterior to the top (F, G, and J). Scale bars: A–C and E–H, 100μm; D, I, and J, 25μm. EXPRESSION / LABELING:
|
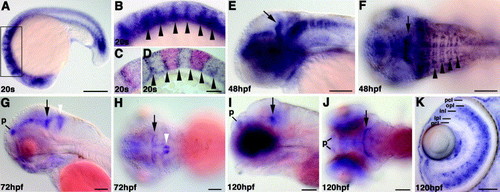
Neural expression of rasgef1b during late embryogenesis and early larval stages. (A–D) rasgef1b expression in 20-somite stage embryo. The region in box (A) is shown in a higher magnification in (B). (C, D) Sagittal sections show overlapping expression of rasgef1b (blue) and pax2.1 (red) in the anterior part of the MHB (C) and expression along the rhombomere boundaries (indicated by black arrowheads in (B) and (D)) in embryos stained for rasgef1b (blue) and krox20 (red). (E, F) rasgef1b expression at 48 hpf in the ventral part of MHB (black arrow), in two stripes of cells adjacent to the rhombomere boundaries (black arrowheads mark the single rhombomere boundaries) and in the dorsal part of the rhombencephalon. At 72 hpf (G, H) and 120 hpf (I, J) rasgef1b expression is detectable in the pallium (p), MHB (black arrow) and the hindbrain (white arrowhead). (K) Cross section of the eye at 120 hpf embryo: expression of rasgef1b is mainly restricted to the inner nuclear layer (inl) and outer plexiform layer (opl). Indicated are photoreceptor layer (pcl), inner plexiform layer (ipl) and ganglion receptor layer (gcl). Embryos are shown from lateral (A, E, G, and I) or dorsal (F, H, and J) with anterior to the left. Scale bars: A, 200μm; D, K, 50μm; E–J, 100μm. EXPRESSION / LABELING:
|
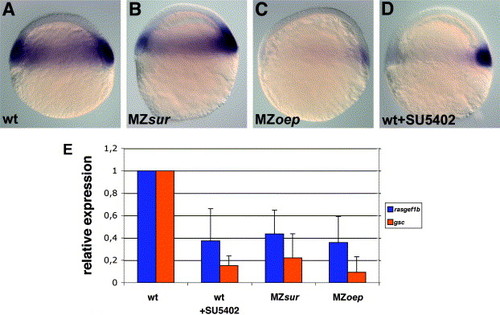
rasgef1b is regulated by Nodal, FoxH1, and FGF signals. (A–D) Expression of rasgef1b in a wild type (wt) embryo (A), MZsur mutant (B), MZoep mutant (C) and a SU5402-treated embryo (D) at 50% epiboly stage. Embryos are shown from lateral with dorsal to the right. (E) Real-time PCR quantification of rasgef1b (in blue) and gsc (in red) expression in MZsur mutants, MZoep mutants and in embryos treated with SU5402 relative to the expression in wild type embryos. EXPRESSION / LABELING:
|
Reprinted from Gene expression patterns : GEP, 7(4), Epting, D., Vorwerk, S., Hageman, A., and Meyer, D., Expression of rasgef1b in zebrafish, 389-395, Copyright (2007) with permission from Elsevier. Full text @ Gene Expr. Patterns