- Title
-
Tracing Hematopoietic Precursor Migration to Successive Hematopoietic Organs during Zebrafish Development
- Authors
- Murayama, E., Kissa, K., Zapata, A., Mordelet, E., Briolat, V., Lin, H.F., Handin, R.I., and Herbomel, P.
- Source
- Full text @ Immunity
|
In Vivo Observation of Hematopoietic Progenitors in the Ventral Tail of Zebrafish through the First Week of Development (A) Anatomical landmarks used in this study: dorsal aorta (da), posterior cardinal vein (pcv), cloaca (c), caudal artery (ca), caudal vein plexus (cvp), thymus (green), pronephric glomerulus (g, yellow), notochord (ntc), somite muscles (s), otic capsule (oc). (B–F) Video-enhanced DIC microscopic observation in the ventral tail, showing progressive accumulation of hematopoietic progenitors (a few shown by black arrowheads) between the CA and definitive CV; (B) 2 dpf; (C) 3 dpf; the lower left panel shows for comparison, both in flat and profile view, the distinct shape of primitive erythrocytes past 2.5 dpf, with a very small nucleus (3.5 μm) and flat elliptical cytoplasm; (D) 4 dpf; (E) 5 dpf; (F) 6 dpf. Green arrowheads, vascular endothelium; Mφ, macrophages. (G and H) DIC, red and green fluorescence overlay images of a gata1-dsred, CD41-gfp double transgenic embryo at (G) 2 dpf and (H) 3 dpf; a dotted line indicates the ventral limit of somite muscles; circulating DsRed+ primitive erythrocytes delineate the blood flow. All lateral views, rostral to the left. Scale bars represent 10 μm in (B)–(F), 100 μm in (G) and (H). |
|
c-myb Expression Reveals the Successive Sites of Larval and Definitive Hematopoiesis Whole-mount in situ hybridization at successive developmental stages. (A) 26 hpf, short after blood circulation onset; position of somite 6 is indicated. (B) Close-up on the area boxed in (A). (C) 5 dpf. (D and E) Ventral views (rostral up) of c-myb+ cells around the pronephric glomerulus (g) at (D) 4 dpf and (E) 5 dpf. (F) 7 dpf. (G) Ventral view (rostral up) of the pronephric region at 7 dpf. (H and I) Higher magnification lateral views (rostral left) of c-myb+ cells in (H) the trunk and (I) the tail, occurring around c-myb- cell clusters (purple arrows). e, primitive erythrocytes; blue arrows, thymus; red arrows, pronephros; green arrows, branchial arches; arrowheads, c-myb+ patches along the PCV. Scale bars represent 200 μm in (A), (C), and (F); 50 μm otherwise. EXPRESSION / LABELING:
|
|
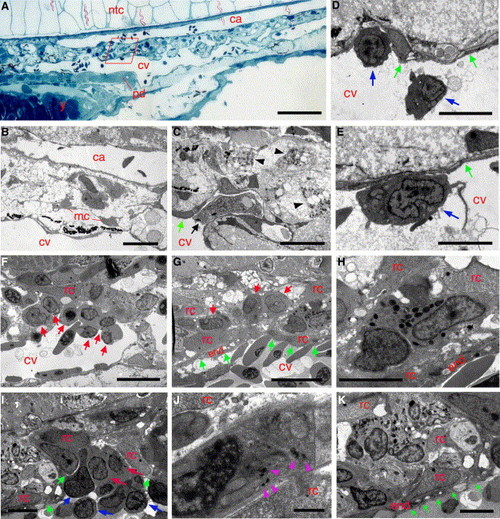
Ultrastructure of the Caudal Hematopoietic Tissue (A–E) 2 dpf. (A) Light microscopy view of a longitudinal section through the CA and CV plexus (rostral left), close to the cloaca (end of pronephric duct (pd)); y, yolk sac. (B) EM view of area boxed in (A), showing mesenchymal cells (mc) in the space between CA and CV. (C) Macrophage in CV plexus lumen (arrow) and differentiated macrophages in the mesenchyme (arrowheads). (D and E) Early, lymphocyte-like hematopoietic precursors in the CV lumen. (F–K) 5 dpf. (F and G) Early presumptive myeloid/erythroid progenitors (red arrows) in the CV lumen (F) and in abluminal cell cords (G) within the meshwork of fibroblastic reticular cells (FRCs) (rc). (H–K) Granulopoiesis in abluminal mesenchyme; (H) eosinophil; (I) myeloblasts (red arrows) and an early precursor (blue arrow); (J) early neutrophilic myelocyte, containing a few, electron-dense cytoplasmic granules (arrowheads); (K) mature neutrophils between FRCs (rc). Note the intimate association between supporting FRCs (rc) and CV endothelium (“end,” and green arrows). Scale bars represent 100 μm in (A); 10 μm in (B), (C), (F), and (G); 5 μm in (D), (E), (H), (I), and (K); and 1 μm in (J). |
|
The Tail Contains Future Immigrants to the Thymus and Pronephros (A–C) Caged fluorescein-dextran-injected embryo exposed to UV light in the tail at 48 hpf, fixed and immunostained for fluorescein at 5 dpf. (A) Apart from the large dark spot at the site of uncaging, and the dark gut and yolk (see Experimental Procedures), all spots are labeled cells that emigrated from the initial site of uncaging: to the thymus in large number (arrow), and to various sites as single cells, green arrowheads pointing at those shown in detail in Figure S4 (same in [E]). (B) Ventral view, showing labeling of both thymi (arrows). (C and D) Lateral view of the labeled left thymus (C), and of that of another embryo treated in the same way (D), showing a subepidermal path of labeled cells (arrowheads) to the thymus (arrow). (E–G) Embryo in which fluorescein was laser-uncaged throughout a portion of the caudal hematopoietic tissue at 72 hpf, followed by immunostaining at 5 dpf. The labeled thymi (blue arrows) and pronephros (red arrow) are shown at higher magnification in (F) and (G), respectively; (F) left (Fa) and right (Fb) lateral views; (G) ventral view rostral up. (H) Similar ventral view of a control embryo (caged fluorescein-dextran-injected but not uncaged); in (G), beside the genuinely labeled cells around and above the glomerulus (g), the distal pronephric tubules (dt) show a vesicular labeling (see Experimental Procedures). (I–K) In situ hybridization for (I) c-myb at 5 dpf, (J) ikaros at 6 dpf; (K) lck+rag1 at 5 dpf reveals a path of cells caudal to the thymus for c-myb and ikaros (arrowheads), but not for lck+rag1. m, muscle. Scale bars represent 100 μm in (B) and 50 μm in (F)–(K). |
|
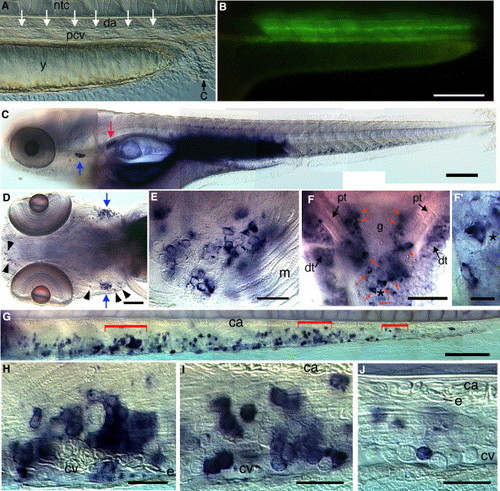
The Trunk DA-PCV Joint Contains Precursors that Will Seed the Caudal Hematopoietic Tissue, Thymus, and Pronephros(A) DIC video image of a live 2 dpf embryo at the posterior trunk level, focused on the sagittal plane; arrows point at the DA-PCV joint targeted with the laser in (B). (B) Fluorescence of fluorescein just laser-uncaged all along the DA-PCV joint. The overlying diffuse labeling is due to marginal uncaging in the somite muscle overlying the target followed by diffusion within the somite muscle fibers. (C–J) Anti-fluorescein immunostaining performed 3 days later (5 dpf). (D) Ventral view of the head, showing the two thymi (arrows); arrowheads point at labeled leukocytes outside the thymi. (E) Magnified ventral view of the right thymus, showing individual labeled thymocytes among unlabeled ones. (F) Pronephros (ventral view, rostral up), with genuinely labeled cells (red arrows) around the glomerulus (g) and vesicular labeling of distal tubules (dt); two labeled cells (asterisk) are shown magnified in (F′). (G–J) Caudal hematopoietic tissue, lateral view, rostral left; areas bracketed in (G) are shown magnified in (H)–(J). Note that none of the hundreds of primitive erythrocytes fixed in the CA is labeled. pt, proximal pronephric tubule; e, erythrocyte. Scale bars represent 200 μm in (C); 100 μm in (D) and (G); 50 μm in (F); 20 μm in (E), (H)–(J); 10 μm in (F2). |
|
Progeny at 5 dpf of Single or Close-to-Single Cells Labeled in the DP Joint at 2 dpfIn each embryo, at 2 dpf, one single cell that could be discerned by DIC optics between the juxtaposed DA and PCV walls was focused and subjected to a 1 s laser hit. Green fluorescence was recorded immediately and overlayed on the DIC image (B, F, K); one cell was visibly uncaged in embryo 2, and 2–3 cells in embryos 1 and 3. Anti-fluorescein immunostaining was performed at 5 dpf. (A) Rostro-caudal position of the cell targeted in the DP joint of embryos 1, 2, and 3. (C–E) In embryo 1, labeled progeny was mostly found in the CHT. (G–J) Embryo 2 displayed numerous labeled cells in both left (G) and right (H) thymus (arrows), one adjacent to the pronephric glomerulus (I, arrow), and several in the CHT (J). (L–O) Embryo 3 displayed numerous labeled cells in the right thymus ([L], [N], lateral and ventral views, respectively), only one in the left thymus (M), and several in the CHT (O) including two amoeboid, presumptively myeloid cells (arrows). In all panels, rostral is to the left, except for those showing the right thymus (H, L, N), in which rostral is to the right. All views are lateral except (H) and (N), which are ventrolateral. To help orientation in the thymus area, the same muscle caudally adjacent to the thymus is indicated in all thymus views by (m). gi, gills; pt, proximal tubule. Scale bars represent 50 μm. |
|
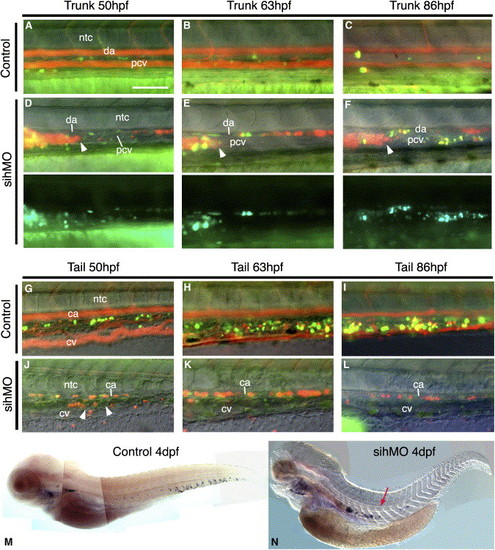
The Seeding of Caudal Hematopoiesis Requires Blood Circulation(A–L) Real-time follow-up of representative control and silent heart morphant [CD41-gfp; gata1-dsred] embryo, at the trunk (A–F) and tail (G–L) level; green+red fluorescence overlaid on DIC images (lateral views, rostral left). In the control embryo, the flow of circulating DsRed+ primitive erythrocytes delineates blood circulation; GFP+ cells develops in the tail (G–I), barely in the trunk (A–C). In the silent heart morphant, many of the noncirculating primitive erythroblasts are gathered in a big mass in the rostral trunk (an arrowhead indicates its caudal border) (D–F); GFP+ cells develop in the trunk ([D]–[F], lower panels show green channel alone) and not in the tail (J–L), despite the presence of a normal CV plexus at 2 dpf ([J], arrowheads). Scale bar represents 100 μm. (M and N) In situ hybridization for c-myb in control and sih morphant embryos. |
|
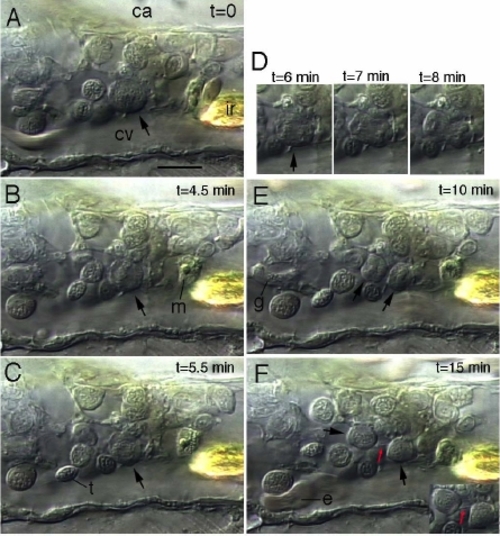
Video-Enhanced Nomarski Images of the Mitosis of a Progenitor in the Caudal Hematopoietic Tissue at 4 dpf Around the cell undergoing mitosis (arrows) appear various other progenitors, plus a macrophage (m) and a granulocyte (g) which migrated away between E and F. (A) Prophase; (B) Metaphase; (C) Anaphase A; (D) Anaphase B and telophase; (E) Daughter cells with condensed chromatin and no nucleus yet; (F) Nuclear assembly almost complete; the two daughter cells are still connected by a tether (red arrow), better seen in the lower right inset; note the deformation of a circulating erythrocyte (e) as it bumped in a progenitor, demonstrating that the latter is intraluminal. Ir, iridophore; bar, 10 μm. |
|
Evolution of the Caudal Vein Plexus Fluorescence images of live [fli1:gfp] (A, D-F) or [fli1:gfp; gata1:dsred] (B,C) transgenic embryos, allowing visualization of endothelial cells in green, and of the flow of circulating erythrocytes - plus some progenitors in the hematopoietic mesenchyme, in red. (A) Short after the onset of blood circulation, the still single-channel caudal vein (′primitive cv′) is sprouting ventralwards all along its length. (B) By 40 hpf, blood cells flow through the multi-channel CV plexus, while by 64 hpf (C,C′) they no longer do, but the endothelial cells are still present (green). (C′) shows by comparing DIC and fluorescence images that the DsRed-positive cells present by then between CA and definitive CV are hematopoietic progenitors; two out of the three visible here appear DsRed-positive (arrows), yet to a lower extent than primitive erythrocytes, one of which is shown above for comparison (e). (D-F) Further evolution of the CV plexus-derived vascular elements, notably to connect intersomitic veins (isv) to the definitive CV. (G-I) Toluidine Blue stained cross sections of the tail, ventral to the notochord, at 2 dpf (G), 4 dpf (H) and 7 dpf (I). All bars, 100μm, except (E, G-I), 50 μm, and (C′), 10 μm. |
|
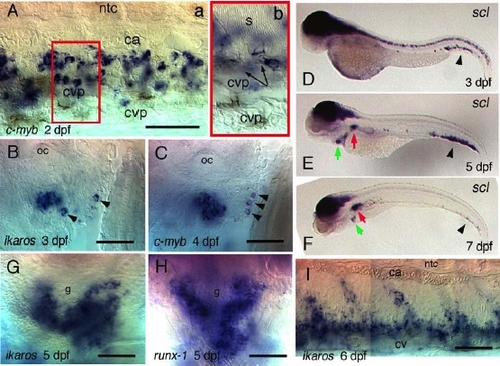
C-myb, scl, ikaros, and runx1 Expression in the Developing Hematopoietic Tissues (A-F,I) lateral views, rostral left; (G,H) ventral views, rostral up; (A) ventral tail at 2 dpf; the area boxed in (a) is displayed enlarged and at a shallower focus in (b), to show that c-myb+ cells are comprised between the caudal artery (ca) and the somite muscle (s) ventral limit (arrows), except for a few in the more ventral CV plexus (cvp) lumen. (B,C) expression in thymus of ikaros at 3 dpf (B) and c-myb at 4 dpf (C); note the single positive cells outside of the thymus anlage, caudalwards (arrowheads); oc, otic capsule. (D-F) From 3 to 7 dpf, scl hematopoietic expression progressively moves from the tail (arrowhead) to the kidney (red arrow); scl+ circulating cells accumulate in the heart (green arrowhead); (G,H) Ikaros (G) and runx1 (H) expression in the 5 dpf kidney, around the pronephric glomerulus (g); (I) Ikaros expression in the 6 dpf tail. Bars, 50 μm |
|
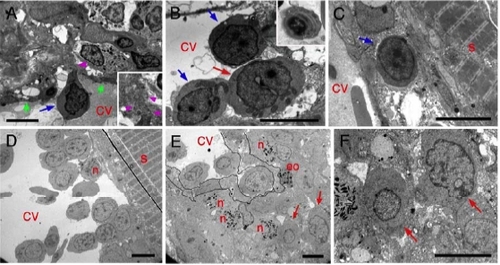
Ultrastructural Organization of the Caudal Hematopoietic Tissue Supplement to Figure 3. (A,B) 5 dpf. Early lymphocyte-like (blue arrows) or myeloblast-like (red arrow) precursors in the CV lumen, one of them (A) crossing (purple arrowheads, see also inset) between CV lumen and abluminal mesenchyme through endothelium (green arrows); (B, inset) thrombocyte in the CV lumen. (C) 7 dpf, early lymphocyte-like precursor (blue arrow) in abluminal position, between endothelial cells and connective tissue. (D-F) 14 dpf; (D) Proerythroblasts, and one neutrophil (n) in the CV lumen, often adherent to its dorsal wall. (E) Granulopoiesis is still active in the mesenchyme, which contains myeloblasts (arrows), neutrophils (n), and eosinophils (eo); endothelial cell limits are delineated; (F) two myeloblasts (arrows) magnified from panel E. All bars, 5 μm |
|
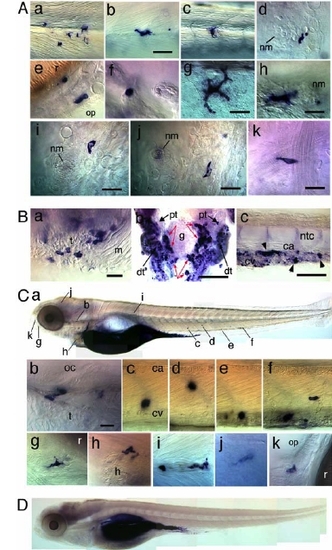
Caged-Fluorescein-Dextran-Based Cell-Tracing Data Supplemental to Figures 4 and 5. (A) Single labelled cells outside hematopoietic tissues in the embryos shown in Figure 4A (af), 4E (g,h) and 5C (i-k); (a-c) in the trunk, beneath the epidermis at or near the horizontal septum; (d,h) At the base of a cephalic (d) or caudal (h) neuromast (nm); (e) Olfactory pit (op); (f) Gills; (g) Anal fin epidermis; (i-k) Ventral head; (B) Labelled cells in the right thymus, ventral view rostral left (a), pronephros, red arrows, dorsal view rostral up (b), and tail, lateral view rostral left (c) of an embryo uncaged in the trunk DA/PCV joint at 3 dpf, immunostained at 5 dpf. (C) Labelled cells found at 5 dpf following uncaging of ten primitive macrophages in the yolk sac at 1 dpf. (b) the labelled macrophage closest to the unlabelled thymus is in contact with the otic epithelium. (c-f) Labelled large (stromal) macrophages in the CHT; (g) mesenchyme rostral to the eye; (h) heart; (i) horizontal septum; (j) brain parenchyme (primitive microglia); (k) olfactory pit. (D) Control embryo, injected with caged-fluorescein dextran and immunostained for fluorescein at 5 dpf with no prior UV-induced uncaging. Only the gut is labelled. R, retina; t, thymus; m, muscle; g, glomerulus; dt, distal tubules; pt proximal tubules. Bars: (A), (B-a), (C), 20 μm; (B-b,c), 50 μm. |
|
Dynamics of Cell Seeding from AGM to CHT and Thymus (A,B) Fluorescent cells at 3 and 4 dpf in the ventral tail (CHT) of a live embryo in which fluorescein-dextran was laser-uncaged along the entire DP joint at 2 dpf (end of uncaged area visible to the left). In (A), two putative pairs of sister cells are shown magnified (arrows). Bar, 100 μm. (C-E) Immunodetection of labelled cells in the right (C) or left (D,E) thymus (arrows) following uncaging in the DP joint and later fixation at the indicated stages. |
Reprinted from Immunity, 25(6), Murayama, E., Kissa, K., Zapata, A., Mordelet, E., Briolat, V., Lin, H.F., Handin, R.I., and Herbomel, P., Tracing Hematopoietic Precursor Migration to Successive Hematopoietic Organs during Zebrafish Development, 963-975, Copyright (2006) with permission from Elsevier. Full text @ Immunity


