
- Title
-
Frizzled3a and Celsr2 function in the neuroepithelium to regulate migration of facial motor neurons in the developing zebrafish hindbrain
- Authors
- Wada, H., Tanaka, H., Nakayama, S., Iwasaki, M., and Okamoto, H.
- Source
- Full text @ Development

olt and ord genes are required for migration of nVII motor neurons. (A-I) Morphology and Isl1-GFP expression of wild-type (A,D,G), MZ-oltrw689 (B,E,H) and MZ-ordrw71 (C,F,I) Isl1-GFP embryos at 48 hpf (A-F) and 30 hpf (G-I). In wild-type embryos (D,G), the nVII motor neurons are located in r6 (arrows). By contrast, in olt (E,H) and ord (F,I) embryos, most or all of the neurons are located in r4 (arrows). In ord embryos (F,I), some neurons migrate into r5 (arrowheads). (A-C,G-I) Lateral views; anterior facing left. (D-F) Dorsal views; anterior at the top. (A-F) Images obtained using a dissecting microscope. (G-I) Composite images of serial optical sections obtained by confocal microscopy. Va, anterior trigeminal nuclei; Vp, posterior trigeminal nuclei; VII, facial nucleus; X, vagus nucleus. Scale bars: 50 μm. The images in A,C,D,F,G,I were previously published in Wada et al. (Wada et al., 2005) |

Identification of the olt gene as zebrafish frizzled3a gene. (A) Genetic map of the olt locus. (B) Genomic structure of the zebrafish fz3a gene. The nucleotide substitution resulting from the oltrw689 mutation is indicated. (C) Schematic drawings for the mouse Fz3 and zebrafish Fz3a proteins. Amino acid sequence similarity (%) is shown for each domain. The mis-sense amino acid substitution in the Fz3arw689 protein is indicated. (D) The phylogenetic tree for fz3-family genes. (E) Lateral view of a wild-type embryo reacted with the fz3a RNA probe at 24 hpf. (E') Cross section of E at r5. (F-H) Wild-type Isl1-GFP embryo injected with fz3a-MO (H) showing the same neuronal migration defects as those observed in an olt embryo (G). The embryos are shown in dorsal view and the images are composite stacks of serial optical sections. (I,I') Wild-type Isl1-GFP embryo injected with fz3a-ΔC mRNA. Migration of the nVII motor neurons was specifically impaired (arrow in I'). Lateral views. Scale bars: 50 μm. PHENOTYPE:
|
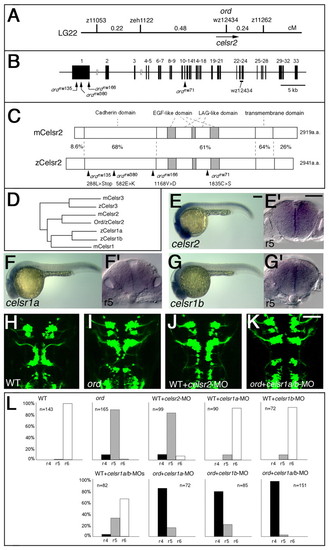
Identification of the ord gene as zebrafish celsr2 gene. (A) Genetic map of the ord locus. (B) Genomic structure of the zebrafish celsr2 gene. The nucleotide substitution resulting from each mutation is indicated. (C) Schematic drawings of the mouse and zebrafish Celsr2 proteins. Amino acid sequence similarity (%) is shown for each domain. The amino acid substitution resulting from each mutation is indicated. (D) The phylogenetic tree for celsrfamily genes. (E-G) Lateral views of wild-type embryos reacted with RNA probes for celsr2 (E), celsr1a (F) and celsr1b (G) at 24 hpf. (E',F',G') Cross sections at r5 for each embryo, E-G, respectively. (H-K) A wild-type Isl1-GFP embryo injected with celsr2-MO (J) shows incomplete disruption of the neuronal migration as observed in an ord embryo (I). (K) An ord mutant embryo injected with celsr1a/1b-MOs shows complete loss of migration of the nVII motor neurons. The embryos are shown in dorsal view and the images are composite stacks of serial optical sections. (L) The neuronal migration phenotype in each experiment was scored as follows: r4, complete loss of migration, as shown in K; r5, partial disruption of migration, as shown in I; and r6, normal migration, as shown in H. Scale bars: 50 μm. |
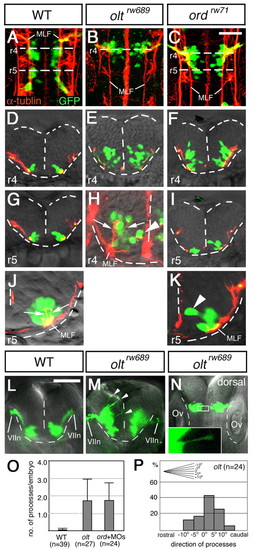
Defective migration of the nVII motor neurons in mutant embryos. (A-K) Wild-type (A,D,G,J), oltrw689 (B,E,H) and ordrw71 (C,F,I,K) Isl1-GFP embryos were stained with anti-acetylated α-tubulin antibody. (A-C) Composite stacks of serial optical sections, shown in dorsal view. (D-K) Images are single focal planes of cross sections at the rhombomeric regions indicated by broken lines in A-C. Hindbrain regions are outlined by broken lines. (H,J,K) Higher magnifications of E, G, I, respectively. In the mutant embryos, some of the neurons reach the ventricular surface (arrowheads in H and K). However, these mismigrated neurons extend axons normally (shown by arrows in H and J). GFP-expression in single axons was barely detectable (H). Therefore, the yellow signals of the axons of the nVII motor neurons in the wild-type embryos (J) are technical artifacts caused by superimposition of the red signals of the axons and the green signals of the cell bodies of the overlapping neurons. (L-P) Aberrant radial processes in the mutant embryos (arrowheads in M). Frontal views of the live wild-type (L) and olt (M) Isl1-GFP embryos at r4, and a dorsal view of the olt Isl1-GFP embryo (N) at 24 hpf. Higher magnification of the boxed region is shown in the inset. (L-N) Images are composite stacks of serial optical sections. (O) Scoring of aberrant processes in the wild-type (WT), olt and ord embryos injected with celsr1a/1b-MOs (ord+MOs). Bars represent S.D. (P) Direction of the aberrant processes was quantified in the olt embryos. The angle of each process was measured as the deviation from the right angle to the midline. Scale bars: 50 μm. PHENOTYPE:
|
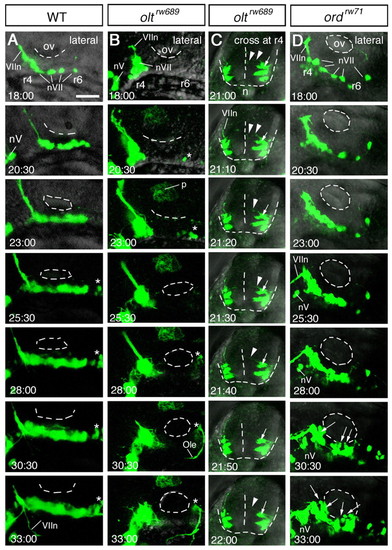
Time-lapse analyses of defective migration of the nVII motor neurons. (A-D) Time-lapse observations of migrating nVII motor neurons in hindbrain explants of the wild-type (A), olt (B,C) and ord (D) Isl1-GFP embryos at the time (hpf) indicated in each panel. (Also see Movies S1-S5 in the supplementary material.) Images are composite stacks of serial optical sections. (A,B,D) Lateral views with anterior to the left; the inner lumen of the otic vesicle (ov) is indicated by broken lines. (C) Frontal views at r4. In the olt embryos, all neurons failed to migrate caudally (B) but mismigrated towards the ventricle (arrows in C) by extending aberrant radial processes (arrowheads in C). In the ord embryo, some of the late-born nVII motor neurons (indicated by arrows in D) migrated caudally in the dorsal part of the hindbrain. nV, trigeminal motor neurons; VIIn, facial motor axons. Asterisks indicate the r6-derived putative octavolateralis efferent (Ole) neurons (Wada et al., 2005). Scale bar: 50 μm. PHENOTYPE:
|
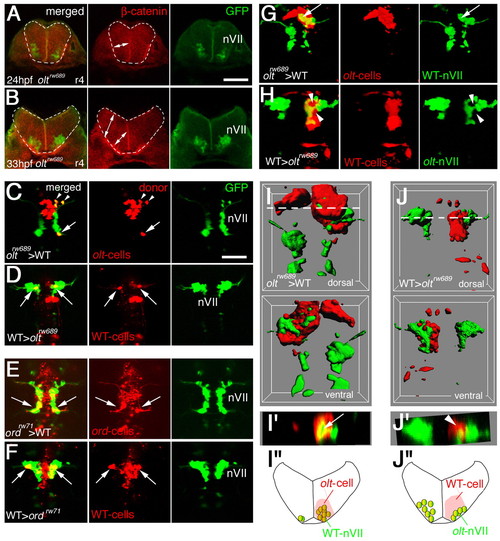
Functional fz3a and celsr2 genes in neuroepithelial cells are required for preventing integration of nVII motor neurons into the neuroepithelium. (A,B) Single focal-plane images of cross sections at r4 in olt Isl1-GFP embryos stained with anti-β-catenin antibody (red) at 24 (A) and 33 (B) hpf. Orientation of the neuroepithelial cells is shown by double-headed arrows. Hindbrain regions are outlined by broken lines. (C-F) Mosaic experiments were performed to determine the cell autonomy of the olt and ord genes. The donor cells were labeled with rhodamine-conjugated dextran (red). The nVII motor neurons (arrows) derived from the oltrw689 (C) and ordrw71 (E) Isl1-GFP embryos migrated caudally in the wild-type host embryos, although some were still located in r4 at the time of observation (arrowheads in C). By contrast, none of the wild-type-derived nVII motor neurons (arrows) reached r6 in the olt (D) and ord (F) host embryos. Red puncta signals may be the debris of the dead transplanted cells. However, as we observed the growth of the peripheral axons of the nVII motor neurons in each mosaic embryo (see Materials and methods), it is unlikely that such debris had serious adverse effects on the development of these embryos. Dorsal views of the embryos are shown. (G-J) Embryos showing mosaicism in the neuroepithelium at the r4 region. When the olt-derived cells were incorporated into the neuroepithelium of the wild-type host embryos at r4, the nVII motor neurons migrated aberrantly into the mutant neuroepithelium (arrows in G and I'). By contrast, when wild-type-derived cells were incorporated into the r4 region of the olt host embryos, the nVII motor neurons failed to invade the wild-type neuroepithelium (arrowheads in H and J'). (C-H) Images are composite stacks of serial optical sections. (I,J) Computationally reconstructed 3D images of the embryos shown in G and H. Dorsal and ventral views of the embryos are shown. In I, mismigrated nVII motor neurons (green) are hidden by the surrounding olt embryo-derived neuroepithelial cells (red) as no transparency was given to the images of the donor-cell clusters. (I',J') Computationally reconstructed cross sections at r4 indicated by the broken line in I and J. (I',J'') Schematic cross sections at r4 of the embryos shown in G and H, respectively. The yellow signals in the merged panels of G and H are technical artifacts caused by the superimposition of the red signals of the donor cells and the green signals of the motor neurons. As red signals were not detected in the axons of the motor neurons (G,H, middle panels), all of the nVII motor neurons were derived from the host embryos. Scale bars: 50 μm in A for A,B; and 50 μm in C for C-H. |

olt and ord genes do not affect overall brain patterning. (A-C) tag-1 mRNA expression in the wild-type (A), oltrw689 (B) and ordrw71 (C) embryos at 24 hpf. Although the nVII motor neurons showed abnormal behavior and ectopic localization in the olt and ord embryos, they expressed tag-1 mRNA, a marker for nVII motor neurons. All or most of the tag-1-positive cells were located in r4 in the olt and ord embryos (arrows in B and C). Some of the tag-1-positive cells were located in r5 in the ord embryos (arrowheads in C). (D-F) Isl1-GFP expression in the wild-type (D), olt (E) and ord (F) embryos at 5 days post-fertilization. The trajectories of facial motor axons were normal in the mutant embryos (arrows) and the axons reached the target muscles. (D′,E′,F′) Higher magnifications of the boxed regions in D-F. (G-O) Expression pattern of the rhombomere-specific genes in the wild-type (G,J,M), olt (H,K,N) and ord (I,L,O) embryos at 20 hpf. Expression patterns of hoxb1a (G-I), krox20 (J-L) and val/mafB (M-O) mRNA were unaffected in the mutant embryos. (P-R) Commissural axons labeled with zn-5 antibody (red) in the wild-type (P), olt (Q) and ord (R) Isl1-GFP embryos at 36 hpf. (S-U) Reticulospinal neurons retrogradely labeled (red) in the wild-type (S), olt (T) and ord (U) Isl1-GFP embryos at 5 hpf. (S′,T′,U′) Single-channel images for the labeled neurons. Dorsal views of the embryos are shown; the anterior of the embryo is at the top of the figure. Va, anterior trigeminal nuclei; Vp, posterior trigeminal nuclei; VII, facial nucleus; X, vagus nucleus; Allg, anterior lateral line ganglion; Pllg, posterior lateral line ganglion; M, Mauthner′s cell. Asterisks indicate the r6-derived putative octavolateralis efferent (OLe) neurons (Wada et al., 2005). Otic vesicles (ov) are indicated by broken lines. Scale bars: 50 μm. EXPRESSION / LABELING:
PHENOTYPE:
|
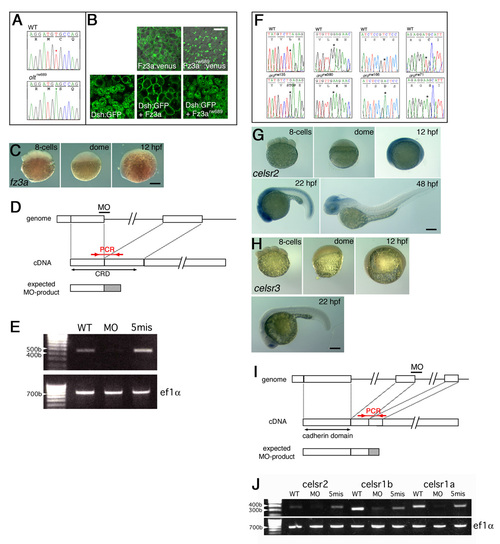
Analyses of the fz3a and celsr genes. (A) Comparison of DNA-sequencing output for the region of the olt mutation and the same region on the wild-type allele. (B) Subcellular localization of Fz3a-Venus and Xdsh-GFP proteins at the blastula stages. Fz3a-Venus, but not Fz3arw689-Venus, was associated with the plasma membrane. Overexpressed Xdsh-GFP localized in the cytoplasmic regions. Co-injection with the fz3a mRNA, but not the mutated fz3arw689 mRNA, resulted in recruitment of Xdsh-GFP to the plasma membrane. Scale bar: 20 μm. (C) Lateral views of wild-type embryos reacted with the fz3a RNA probe at the indicated embryonic stages. fz3a mRNA was slightly expressed in the brain at 12 hpf. (D) The position of fz3a-MO was designed to disrupt the splicing of the first intron of the fz3a transcript, giving rise to a protein containing the truncated CRD with 19 irrelevant amino acids. (E) RT-PCR analyses were performed as described (Goutel et al., 2000). The analyses showed a significant reduction of the normal fz3a mRNA in the fz3a-MO injected embryos. The primers used to detect the mRNA (positions are indicated in D) were shown in Table1. Control primers were used to amplify the ef1a gene (Goutel et al., 2000). (F) Comparison of DNA sequencing output for the regions of the ord mutations and the same regions on the wild-type allele. (G-H) Expression patterns of celsr2 (G) and celsr3 (E) genes at the indicated embryonic stages. celsr2 was detected throughout the embryo in the gastrula stages and became restricted to the CNS region thereafter. celsr3 mRNA was barely expressed in the hindbrain. Lateral views of the embryos are shown. (I) The positions of celsr1a-MO, celsr1b-MO and celsr2-MO were designed to disrupt the second intron of each gene transcript, giving rise to truncated proteins containing the cadherin repeats domain with 39 irrelevant amino acids (celsr2-MO) or 17 irrelevant amino acids (celsr1a-MO and celsr1b-MO). (E) RT-PCR analyses showed significant reductions in the normal celsr mRNA in embryos injected with each MO. The primers used to detect mRNA (positions are indicated in I) were shown in Table1. Scale bars: 50 μm. |

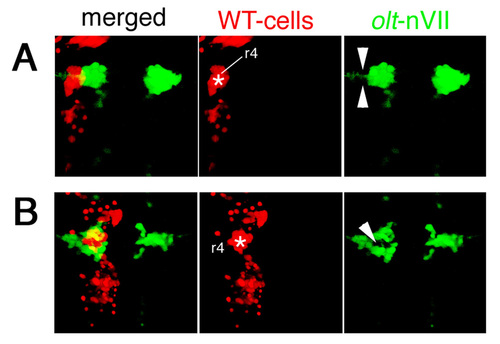
Behavior of the nVII motor neurons compared with the neighboring neuroepithelial cells. (A,B) To compare the behavior of the nVII motor neurons with the neighboring neuroepithelial cells, we observed mosaic embryos obtained by the transplantation of WT>WT (A) and ord>ord (B) Isl1-GFP embryos. The donor cells labeled with rhodamine-conjugated dextran (red) were incorporated into the neuroepithelium. Behavior of the nVII motor neurons (green) was shown at the time indicated in each panel (hpf). In the wild-type embryo, the nVII motor neurons migrated caudally relative to the neighboring cells and they were associated with the pial surface of the brain (A). By contrast, in the ord embryo, one of the nVII motor neurons (indicated by arrows) became detached from the pial surface of the brain (B). Single optical planes are shown in dorsal view. Pial surfaces of the brain are indicated by lines. Double-headed arrows indicate midlines of the embryos. (A′,B′) Schematic drawings of each panel. (C,C′) Single optical plane of a cross section at r5 from a mosaic embryo obtained by the transplantations of WT>WT Isl1-GFP embryos at 24 hpf. The donor cells labeled with rhodamine-conjugated dextran (red) were incorporated into the neuroepithelium. Most of the labeled neuroepithelial cells were round in shape (C). However, when the images were obtained at a higher amplified gain (C′), long processes associated with ventricular and pial surfaces were detected (arrows in C′). These results suggest that the rhodamine-conjugated dextran strongly stained cell bodies around the nuclei, but weakly stained cellular processes in the neuroepithelial cells. Pial and ventricular surfaces are indicated by broken lines. Because most of the mosaic embryos were observed at lower gains to reduce the noise, the long neuroepithelial processes were not imaged. |

Extension of the nVII motor axons in an olt Isl1-GFP embryo. Time-lapse observations of the extension of an nVII motor axon (arrows) in a hindbrain explant from an olt Isl1-GFP embryo at the time indicated in each panel (hpf). Such axons extended dorsolaterally from the cell bodies of the nVII motor neurons and exited the hindbrain. Frontal views at r4. Hindbrain regions are outlined by broken lines. |

Examples of mosaic embryos containing many donor cells. Additional examples of the mosaic embryos obtained by the transplantations of olt>WT (A), WT>olt (B), ord>WT (C) and WT>ord (D) Isl1-GFP embryos. The donor cells were labeled with rhodamine-conjugated dextran (red). In these examples, many donor cells (arrows) were incorporated into the host embryos. Images are composite stacks of serial optical sections, shown in dorsal view. See also Fig. 6C-F. |
Examples of other embryos showing mosaicism in the neuroepithelium. Two additional examples of mosaic embryos obtained by transplantations of WT>olt Isl1-GFP embryos. The donor cells were labeled with rhodamine-conjugated dextran (red). (A) In this mosaic embryo, the wild-type donor-cell cluster (red) was located in the lateral part of the neuroepithelium (asterisk) and the olt-derived nVII motor neurons (green) failed to invade this region (arrowheads in A). (B) In this mosaic embryo, the wild-type donor-cell cluster (red) was located in the medial part of the neuroepithelium (asterisk), and the olt-derived nVII motor neurons (green) were also excluded from this wild-type donor-cell cluster (arrowhead in B). The yellow signals in the merged panels are technical artifacts caused by superimposition of the red signals of the donor cells and the green signals of the nVII motor neurons. As red signals were not detected in the axons of the nVII motor neurons, all of the nVII motor neurons were derived from the olt host embryos. Images are composite stacks of serial optical sections, shown in dorsal view. See also Fig. 6H. |

OLe neurons fail to migrate caudally in the ord Isl1-GFP embryos. The lateral line was retrogradely labeled with DiI (red) in ord Isl1-GFP embryos at 30 hpf. In the ord embryos, some of the nVII motor neurons migrated caudally to r5 (arrow). DiI labeling demonstrated that the OLe neurons failed to migrate caudally in the ord embryos (arrowhead). Sites of the DiI application are indicated by triangles. Composite stacks of serial optical sections are shown in dorsal view. A single-channel image of the labeled neuron is shown in the right panel. Scale bars: 50 μm. PHENOTYPE:
|