- Title
-
Global analysis of hematopoietic and vascular endothelial gene expression by tissue specific microarray profiling in zebrafish
- Authors
- Covassin, L., Amigo, J.D., Suzuki, K., Teplyuk, V., Straubhaar, J., and Lawson, N.D.
- Source
- Full text @ Dev. Biol.
|
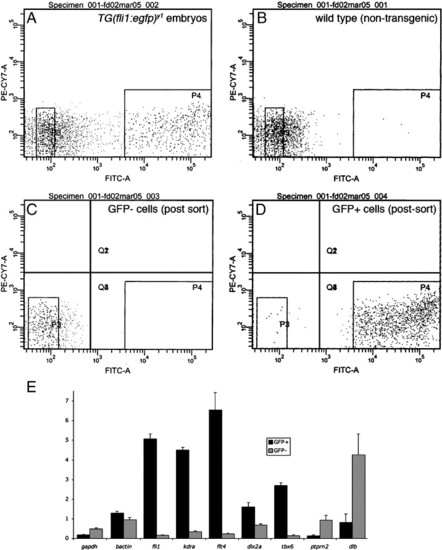
Enrichment of GFP+ cells from Tg(fli1:egfp)y1 zebrafish embryos. (A-D) Diagnostic fluorescence activated cell sorting of dissociated Tg(fli1:egfp)y1 embryos. (A) Cells from Tg(fli1:egfp)y1 embryos. (B) Cells from non-transgenic wild type embryos. (A, B) P3 and P4 demarcate cells sorted as GFP- and GFP+, respectively. (C) GFP- cells following FACS isolation. (D) GFP+ cells following FACS isolation. (E) Relative expression of indicated genes in GFP+ (black bars) and GFP- (gray bars) determined by quantitative RT-PCR. Relative expression levels were determined by normalization to ef1a. |
|
Quantitative RT-PCR analysis of previously described non-fli1+ and ubiquitously expressed genes (see Table 2). qRT-PCR was performed on RNA derived from fli1:egfp+ (black bars) and egfp- (gray bars) cells from 22 to 24 hpf embryos. EXPRESSION / LABELING:
|
|
Whole mount in situ hybridization analysis of blood cell markers. (A, B) Dr.1382 at 26 hpf; box indicates magnified view in panel B. (B) Arrows indicate expression in erythroid cells; nc-notochord. (C-E) Dr.30834 at 26 hpf; box indicates magnified view in panel D. (E) Dorsal view of head, anterior is up; white arrow indicates expression in the heart. (F-H) Dr.919 at 24 hpf. (F) Box indicates magnified view in panel G. (H) Dorsal view of the head, anterior is up. White arrows denote expression in white blood cells on yolk sac. (I-K) Dr.6172 at 24-hpf. (I) Black box indicates magnified view in panel J, white box indicates view in panel K. (J) Expression in floor plate (fp), hypochord (hc) and a blood cell (bc). (K) Blood cells expressing Dr.6172 indicated with black arrows. White arrows denote adjacent cells with similar morphology that do not express Dr.6172. (A-D, F, G, I, J) Lateral view, dorsal is up anterior to the left. EXPRESSION / LABELING:
|
|
Whole mount in situ hybridization analysis of cardiovascular markers. (A, B) Dr.24287 at 24 hpf; box indicates magnified view in panel B. (B) Black bracket indicates dorsal aorta, white bracket shows posterior cardinal vein. (C-E) Dr.9655. (C) Embryo at 30 hpf. (D) Magnified view of dorsal aorta (red bracket) and posterior cardinal vein (white bracket) at 24 hpf; (E) dorsal aorta (red bracket) and posterior cardinal vein (white bracket) at 30 hpf. (F, G) Dr.33656. (G) Expression in segmental arteries (black arrow) and dorsal aorta (red bracket); expression is absent from posterior cardinal vein (white bracket). (H, I) Dr.398 at 24 hpf. (H) Arrow indicated expression in heart; inset head-on view showing heart expression (arrow). (I) Magnified view of embryo in panel H. |
|
Whole mount in situ hybridization analysis of pharyngeal arch markers. (A, B) Dr.51180 at 26 hpf; arrow indicates expression in trunk blood vessels. (B) Dorsal view of head of embryo in panel A; arrows indicate expression in pharyngeal arches. (C, D) BI671621. (D) Dorsal view of head of embryo in panel C; arrows indicate expression in pharyngeal arches. EXPRESSION / LABELING:
|
|
plcg1 and mib are required for artery-specific expression of Dr.33656. (A) Wild type embryo. (B) Embryo mutant for plcg1y18. (C) Embryo mutant for mibta52b. (D) Embryo injected with 5 ng Rbpsuh Morpholino. Lateral views, anterior to the left, dorsal is up. (A-D) White arrow indicates expression in pronephric ducts (out of focal plane). Red bracket demarcates dorsal aorta in panels A-D, and white bracket indicates posterior cardinal vein in panel A. EXPRESSION / LABELING:
|
|
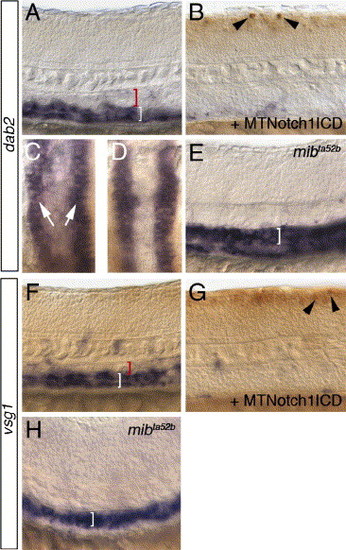
Notch represses dab2 and vsg1 expression. (A–E) dab2 expression. (A) Wild type sibling embryo following heat shock. Red bracket indicates dorsal aorta, white bracket posterior cardinal vein. (B) Tg(hsp70:gal4)kca4;Tg(uas:myc-notch-intra)kca3 embryo following heat shock. Myc-positive cells in the neural tube are indicated by black arrowheads. (C, D) Dorsal view of dab2 expression in pronephric ducts (white arrows). (C) Same embryo as shown in panel A; (D) same embryos as seen in panel B. (E) Ectopic dab2 expression in the dorsal aorta (white bracket) of an mibta52b mutant embryo. (F–H) vsg1 expression. (F) Wild type sibling embryo following heat shock. Red bracket indicates dorsal aorta, white bracket posterior cardinal vein. (G) Tg(hsp70:gal4)kca4;Tg(uas:myc-notch-intra)kca3 embryo following heat shock. Myc-positive cells in the neural tube are indicated by black arrowheads. (H) Ectopic vsg1 expression in the dorsal aorta (white bracket) of an mibta52b mutant embryo. EXPRESSION / LABELING:
|
|
A Zebrafish microarray database. (A) Opening page of database with possible pairwise combinations and user defined analysis. (B) Results output page showing accession number, gene name, Unigene and values from selected microarray experiment. Also includes links to in situ data. (C) Example of and individual gene page with values across all available microarray data. |

ZFIN is incorporating published figure images and captions as part of an ongoing project. Figures from some publications have not yet been curated, or are not available for display because of copyright restrictions. |
Reprinted from Developmental Biology, 299(2), Covassin, L., Amigo, J.D., Suzuki, K., Teplyuk, V., Straubhaar, J., and Lawson, N.D., Global analysis of hematopoietic and vascular endothelial gene expression by tissue specific microarray profiling in zebrafish, 551-562, Copyright (2006) with permission from Elsevier. Full text @ Dev. Biol.


