- Title
-
Inhibition of BMP signaling during zebrafish fin regeneration disrupts fin growth and scleroblast differentiation and function
- Authors
- Smith, A., Avaron, F., Guay, D., Padhi, B.K., and Akimenko, M.A.
- Source
- Full text @ Dev. Biol.
|
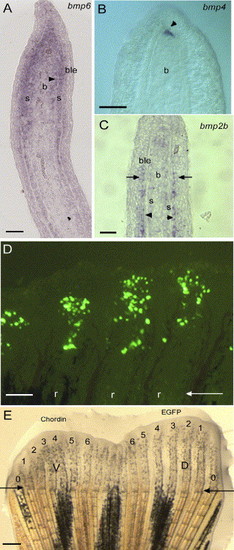
Expression of bmp2, 4 and 6 on longitudinal sections of 4 dpa fin regenerates using in situ hybridization. (A) bmp6 is expressed in the scleroblasts, cells medial to the actinotrichia (arrowhead), cells of the basal layer of the epidermis in the distal part of the regenerate and the proliferating blastema. (B) bmp4 expression is restricted to the distal blastema (arrowhead). (C) bmp2b expression is found in the newly differentiating scleroblasts and in the adjacent cells of the basal layer of the epidermis (arrow). (D) EGFP expression in 20 to 50 mesenchymal cells 1 day after in vivo transfection by microinjection of the CMV-EGFP reporter construct into the blastema of three fin rays at 3 dpa. (E) Zebrafish caudal fin 3 days following injection of the CMV-EGFP construct in the blastema of rays 1 to 6 of the dorsal half of the fin and of the CMV-chordin construct in the ventral (V) rays (1-6). Outermost non-bifurcating rays (rays 0) were not counted. Arrows in panels D and E indicate the level of amputation. D, dorsal; V, ventral. 1-6 represent ray number. r, fin ray; s, scleroblasts; b, blastema; ble, basal layer of the epidermis. Scale bars: (A-C) = 25 μm, (D) = 100 μm, (E) = 400 μm. EXPRESSION / LABELING:
|
|
Effects of chordin injection on ray length. (A) Regenerating fin at 3 dpa immediately before injection showing that the lengths of the regenerating rays on the dorsal and ventral sides are the same. (B) One day post injection (1 dpi) of chordin (ventral side, left side of the panel) and EGFP (dorsal side, right side of the panel) constructs at 4 dpa, a size difference between the two sides is noticeable. (C) Control fin 1 day following injection of EGFP construct in all the fin rays shows no size difference between the ventral and dorsal sides. (D-F) Pictures showing the same fin at different time points following injections at 3 dpa and 5 dpa (D: 6 dpa/1 dpi, E: 7 dpa/2 dpi and F: 8 dpa/3 dpi). A pronounced length difference of the ventral versus dorsal fin rays is observed. (G, H) Percentage length difference of dorsal EGFP-injected rays compared to ventral chordin-injected rays was calculated and plotted for rays 1-6 at 1 dpi (G) and 2 dpi (H) following a single injection of chordin (blue bars). The most noticeable differences were observed in the outer rays. A control group of fish was injected withEGFP in all dorsal and ventral rays and plotted on the same graph to show no significant difference in length between dorsal and ventral rays (red bars). Arrows indicate level of amputation. Scale bars: (A-F) = 400 μm. |
|
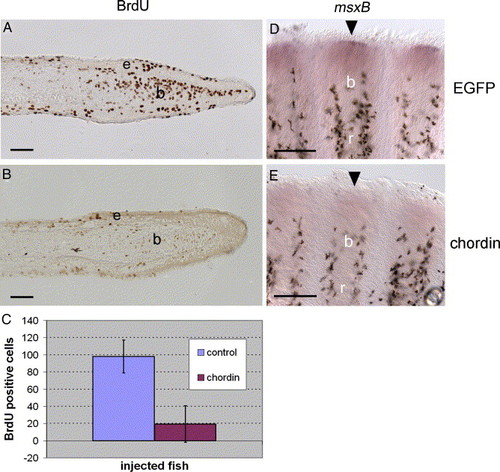
Reduced cell proliferation and msxB expression following chordin construct injection. (A-B) Immunodetection of BrdU incorporation using an anti-BrdU antibody on longitudinal sections of fin rays at 4 dpa, 1 day after EGFP (A) and chordin (B) injections. Fish were treated with BrdU for 16 h starting immediately after injection. (C) For statistical purposes, BrdU labeled cells were counted on 20 sections of chordin-injected fin rays (n = 4 rays) and 9 sections of EGFP-injected rays (n = 2 rays) and the mean number of BrdU positive cells was calculated for both groups and plotted on a graph (Chordin = 19.4 cells, EGFP = 98.1 cells). Student′s t test results indicate that injection of chordin significantly decreased the number of proliferating cells within the blastema (P < 0.0001). (D-E) msxB gene expression on whole-mount fins at 4 dpa, 1 day after EGFP (C) and chordin (D) injections. msxB expression in the distal blastema (D, arrowhead) is strongly reduced in chordin-injected rays (E, arrowhead). b, blastema, e: epidermal layer, r: fin ray. Distal part of the regenerate is to the right (A, B) and to the top (D, E). Scale bars: (A, B) = 25 μm, (D, E) = 100 μm. EXPRESSION / LABELING:
|
|
Morphology of the fin rays following chordin injection. Comparison of the ossification progression using Alizarin red staining in rays 1, 2 and 3 of the EGFP and chordin-injected lobes at 9 dpa/6 dpi shows a reduction of matrix mineralization in chordin-injected rays. (B-G) Immunodetection of the scleroblasts using the Zns-5 scleroblast-specific antibody on longitudinal sections of fin regenerates at 5 dpa, 2 days after injection of EGFP (B, D, E) and of chordin (C, F, G). (B) In the control rays at 5 dpa, newly differentiating scleroblasts (arrowheads) in the distal region (dashed box on the right side of the panel) are located on the internal surface of the bone matrix while more mature bone secreting cells are found on the internal (red arrow) and external (black arrows) surfaces of the proximal lepidotrichia (dashed box on the left side of the panel). (C) chordin-injected regenerate at 5 dpa shows fewer mature scleroblasts on the external surface of the proximal lepidotrichia (black arrow) and is shorter in length compared to the control regenerate. (D-G) Higher magnification of the dashed boxes shown in panels B and C; (D, E) proximal and distal regions, respectively, of the control EGFP-injected rays and (F, G) proximal and distal regions, respectively, of the chordin-injected rays. Note the reduced number of mature scleroblasts on the external surface of the proximal part of the lepidotrichia (F) when compared to the control ray (D); the flattened shape of the scleroblasts on the internal and external surfaces of the lepidotrichia only observed in the proximal part of the regenerate of the control EGFP-injected rays; the reduced bone thickness observed in the proximal part of the regenerate of chordin-injected rays (F) when compared to the corresponding region of the control ray (D) as indicated by the bars [I]; and the absence of bone matrix in the distal part of the chordin-injected rays (G) compared to the corresponding region in the control ray (E). Arrows in panel A and solid lines in panels B and C indicate the level of amputation. Arrowheads in panels B and C indicate newly differentiating scleroblasts L, lepidotrichia; s, scleroblasts; b: blastema. Distal part of the regenerate is to the top (A) and to the right (B-G). Scale bars: (A) = 100 μm, (B, C) = 25μm, (D-G) = 50 μm. |
|
Gene expression analysis using in situ hybridization on sections of 4 dpa regenerates. The pictures are focusing on a portion of the distal part of the regenerate taken at the same proximal–distal level and highlighting the common expression of runx2a, runx2b, bmp6, bmp2b and ihha in the newly differentiating scleroblasts. (A–B) The duplicate genes runx2a and runx2b are expressed in the differentiating scleroblasts in an overlapping expression pattern as seen on these adjacent sections (16 μm apart). (C) bmp6 is expressed in the differentiating scleroblasts, the mesenchymal cells of the blastema and a subset of cells of the basal epidermal layer. (D, E) bmp2b and ihha are similarly expressed within differentiating scleroblasts. Dashed lines separate different cell types within the fin regenerate. b, blastema; ble, basal layer of the epidermis; m, mesenchyme; s, scleroblasts. Scale bars: (A–E) 12.5 μm. EXPRESSION / LABELING:
|
|
Gene expression analysis using in situ hybridization on whole-mount and longitudinal sections of EGFP (A, C, F, H, J) and chordin-injected rays (B, D, G, I, K) at 4 dpa/1 dpi. (A-D) runx2a and runx2b are both expressed within newly differentiating scleroblasts (arrowheads in panels A and C) in control regenerates and are both downregulated following chordin injection (B, D). (E-F) col10a1 expression on whole-mount 3 dpa regenerate (E) and 4 dpa regenerate 1 day following EGFP construct injection (F). At 3 dpa col10a1 is already strongly expressed in the entire fin ray and presents a stronger expression in the distal part of the regenerate. At 4 dpa/1 dpi, in the EGFP-injected fin rays, a similar strong expression is observed with a broad domain in the distal part of the regenerate. (G) In contrast, in the chordin-injected rays, col10a1 expression at 4 dpa/1 dpi is reduced and observed in a more restricted domain in the distal part of the regenerate. (H, I) ihha expression in the distal scleroblasts (arrowheads) of EGFP-injected rays (H) is unaffected in chordin-injected rays (I). (J, K) shh expression in the basal epidermal layer is unchanged in both EGFP (J) and chordin-injected rays (K). Asterisks in panels J and K indicate blood vessels. b, blastema; ble, basal layer of the epidermis; s, scleroblasts. Distal part of the regenerate is to the right (A-D, H-K) and to the top (E-G). Arrows indicate level of amputation. Arrowheads show expression of col10a1 in each ray in panels E-G. Scale bars: (A-D, H-K) = 25 μm, (E-G) = 100 μm. EXPRESSION / LABELING:
|
|
(A–F) In situ hybridization on longitudinal sections of 4 dpa fin regenerates showing sox9a (A, B), sox9b (C, D) and col2a1 (E, F) expression. (A) sox9a is expressed in the mesenchyme of the blastema, in a few cells of the basal layer of the epidermis (arrow) and in newly differentiating scleroblasts (asterisk). (B) 1 day following injection of chordin, sox9a expression is downregulated. (C) sox9b is expressed in cells of the basal epidermal layer in the distal part of the regenerate (arrow). (D) sox9b expression is unaffected in chordin-injected rays at 1 dpi. (E) col2a1 is strongly expressed in the scleroblasts, in cells surrounding the actinotrichia (white arrowheads), the mesenchyme of the blastema and faintly in the basal epidermal layer (arrow). (F) col2a1 expression is partially downregulated in the scleroblasts and mesenchyme following chordin injection but is still present in cells surrounding actinotrichia (white arrowheads). (G) Alcian blue staining shows that the regenerate is devoid of any cartilage cells although staining is observed in the lepidotrichial material and in a few mucous cells (arrows). ble, basal layer of the epidermis, b, blastema; s, scleroblasts. Distal part of the regenerate is to the right. Scale bars: (A–G) = 25 μm. EXPRESSION / LABELING:
|
|
Expression of msxC at 4 dpa using in situ hybridization on whole-mount fins 1 day after injection of EGFP (A, C) and chordin (B, D). msxC expression seen in the distal blastema of 2 fin rays (A) and on a higher magnification image of the domain of expression in the blastema of one ray indicated by an asterisk in (C), 1 day following EGFP injection. The expression is strongly reduced in the distal blastema 1 day following chordin injection as seen on 2 fin rays (B) and at a higher magnification of the distal blastema of the ray indicated by the asterisk in (D). Scale bars: (A, B) = 20 μm; (C, D) = 40 μm. EXPRESSION / LABELING:
|
|
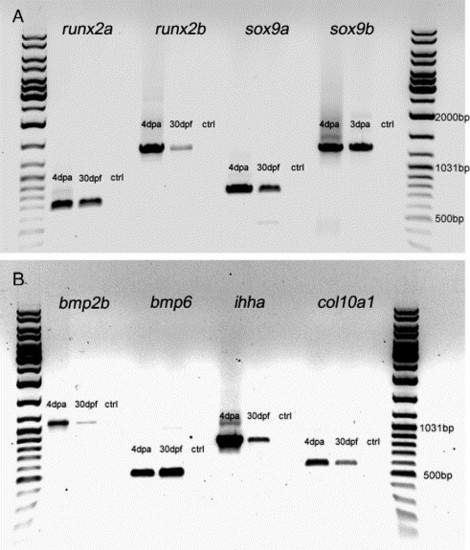
RT-PCR analysis of various cartilage and bone genes on caudal fins of 30-day-old larvae and 4 dpa fin regenerates. Total RNA was prepared from 50 caudal fins of 30-day-old larvae using Trizol (Invitrogen) (samples only contained the distal half of the fin to avoid the endochondral bones at the base of the fin rays) and from 20 fin regenerates. RNA was reverse-transcribed using Superscript II Reverse Transcriptase (Invitrogen). Gene specific primers (see below) to amplify cDNA fragments for the transcription factors sox9a, sox9b, runx2a and runx2b; the signaling molecules bmp2b, bmp6 and ihha; and the extracellular matrix molecule col10a1 were used for PCR analysis. cDNA from 4-day regenerates was used as a positive control for gene expression, and a water control was used as a negative control. The PCR products were ran on an agarose gel beside a GeneRuler DNA Ladder Mix. (A, B) runx2a, runx2b, sox9a and sox9b and (A) bmp2b, bmp6, ihha and col10a1 (B) were all expressed in 4-day regenerates and 30-day larvae fins. For runx2a, runx2b, sox9a, sox9b and bmp6 primers, see Materials and methods. Other gene specific primers used: ihha forward: 5′ATGCGTCTCCCCGTGGTGTT3′ ihha; reverse: 52TCATCTATCATTGTCCATCATGC3′. bmp2b forward: 5′TTGGACTCATTCCCGAGATCG3&prime& bmp2b reverse: 5′GTACTCGTCCAGGTACAGCA3′. col10a1 forward: 5′ATGTCCATTGCTCTTTCTCTG3&prime& col10a1 reverse: 5′CATAATGGTTTACAGAGCAAA3′. EXPRESSION / LABELING:
|

Unillustrated author statements EXPRESSION / LABELING:
|
Reprinted from Developmental Biology, 299(2), Smith, A., Avaron, F., Guay, D., Padhi, B.K., and Akimenko, M.A., Inhibition of BMP signaling during zebrafish fin regeneration disrupts fin growth and scleroblast differentiation and function, 438-454, Copyright (2006) with permission from Elsevier. Full text @ Dev. Biol.


