
- Title
-
Fgf19 regulated by Hh signaling is required for zebrafish forebrain development
- Authors
- Miyake, A., Nakayama, Y., Konishi, M., and Itoh, N.
- Source
- Full text @ Dev. Biol.
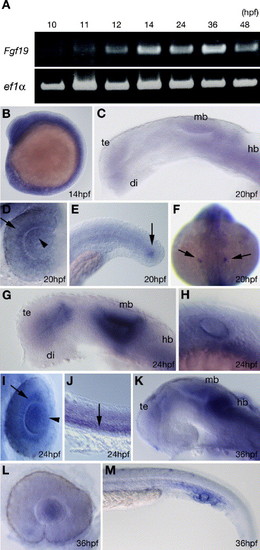
Expression pattern of Fgf19 during zebrafish embryonic development. (A) Amplification of zebrafish Fgf19 by RT-PCR at the indicated stages. The lower panel shows results for zebrafish elongation factor 1-alpha (ef1α) as a control. (B–M) Expression pattern detected by whole mount in situ hybridization. (B) Fgf19 was expressed throughout the embryo at 14 hpf. (C–F) 20 hpf. (C) Fgf19 was expressed in the ventral telencephalon, anterior ventral thalamus, midbrain and hindbrain. (D) Dorsal view with anterior to the top. Fgf19 was expressed in the retina adjacent to the lens (arrow) and the nasal part of the lens (arrowhead). (E) Fgf19 expression in the tail bud mesenchyme (arrow). (F) Dorsal view of whole embryos, with anterior to the top. Fgf19 expression in the otic placode (arrow). (G–J) 24 hpf. (G) Fgf19 was expressed in the ventral thalamus, the ventral part of the telencephalon and the tectum and the dorsal part of the tegmentum in the brain. (H) Fgf19 expression in the otic vesicles. (I) Dorsal view with anterior to the top. Fgf19 expression was still prominent in the retina adjacent to the lens (arrow) and expanded to the entire lens (arrowhead). (J) Fgf19 expression in the somites (arrow). (K–M) 36 hpf. (K) Fgf19 was expressed in the thalamus, pretectum, midbrain, hindbrain and most posterior part of the telencephalon. (L) Fgf19 expression persisted in the lens but was no longer detected in the retina. (M) Fgf19 was expressed in the ICM. All panels show lateral views with anterior to the left and dorsal to the top, except when indicated. di, diencephalon; hb, hindbrain; mb, midbrain; te, telencephalon. |
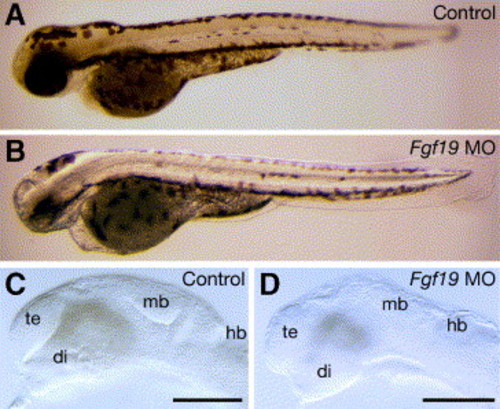
Morphology of the Fgf19 MO-injected embryos. Embryos were injected with control Fgf19 MO (A and C) and Fgf19 MO (B and D). (A and B) 60 hpf. The Fgf19 MO-injected embryos had defects in the brain and eye. (C and D) 24 hpf. In the Fgf19 MO-injected embryos, the forebrain, midbrain and cerebellum were reduced in size. Lateral views with anterior to the left and dorsal to the top. di, diencephalon; hb, hindbrain; mb, midbrain; te, telencephalon. Scale bars, 30 μm. |
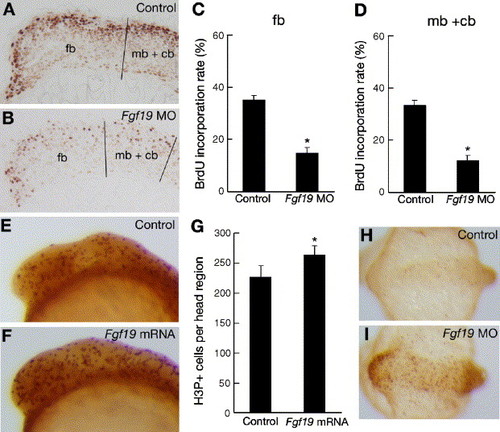
Comparison of cell proliferation and cell death patterns in control embryos and Fgf19 MO- or Fgf19 mRNA-injected embryos. (A and B) Embryos injected with control Fgf19 MO (A) and Fgf19 MO (B) were labeled with BrdU and stained using an anti-BrdU antibody. Lateral views with anterior to the left and dorsal to the top. (A) BrdU-positive cells (light brown in A) were mostly detected in the dorsal region of the brain in the control embryos at 16 hpf. (B) Representative sagittal sections of the head region of stained embryos that show fewer labeled cells (light brown in B) in the Fgf19 MO-injected embryos. (C and D) The proportions of BrdU-positive cells in the forebrain (C) and the midbrain and cerebellum (D) of the control Fgf19 MO-injected and Fgf19 MO-injected embryos were quantitatively examined by counting BrdU-positive and -negative cells in the sections. Results are the means ± SD for three independent sections from three embryos. Asterisks indicate statistical significance compared with the control (*P < 0.005). The forebrain (fb), and the midbrain and cerebellum (mb + cb) regions, which we defined in the sections, are separated by black lines. (E and F) Wild-type embryos (E) and embryos injected with Fgf19 mRNA (F) were stained using an anti-H3P antibody. Lateral views with anterior to the left and dorsal to the top. Increased numbers of H3P-positive cells (dark brown in panel F) were detected in the head region of the Fgf19 mRNA-injected embryos compared with the wild-type embryos at 16 hpf. (G) Numbers of H3P-positive cells in the forebrain, midbrain and cerebellum of the wild-type and Fgf19 mRNA-injected embryos were counted. Results are the means ± SD for four embryos. Asterisks indicate statistical significance compared with the wild type (*P < 0.05). (H and I) Apoptotic cells in the wild-type embryos (H) and embryos injected with Fgf19 MO (I) were marked by TUNEL staining. Dorsal views with anterior to the left. Substantially, increased numbers of apoptotic cells (light brown in I) were detected in the head region of the Fgf19 MO-injected embryos at 16 hpf. |
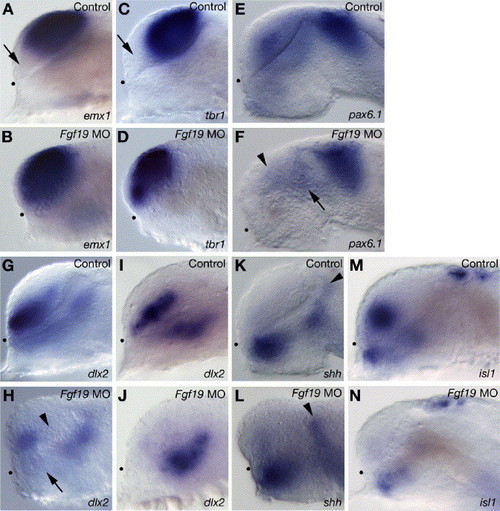
Telencephalic and diencephalic gene expression in the Fgf19 MO-injected embryos. Embryos were injected with control Fgf19 MO (A, C, E, G, I, K and M) and Fgf19 MO (B, D, F, H, J, L and N). (A–D) The pallial telencephalic markers, emx1 (A and B) and tbr1 (C and D) were expressed in both the pallial and subpallial telencephalon in the Fgf19 MO-injected embryos at 25 hpf. Arrows in panels A and C indicate the subpallial telencephalon that is negative for emx1 or tbr1. (E and F) In the Fgf19 MO-injected embryos, pax6.1 expression in the posterior ventral thalamus (arrow) and dorsal thalamus was unaltered, while the expression in the telencephalon (arrowhead) was reduced at 25 hpf. (G and H) In the Fgf19 MO-injected embryos, dlx2 expression was completely lost in both the posterior ventral telencephalon (arrowhead) and anterior ventral thalamus (arrow) at 25 hpf. (I and J) In the Fgf19 MO-injected embryos, dlx2 expression in the ventral thalamus was unaltered, while the expression in the telencephalon was lost at 16 hpf. (K and L) shh was expressed in similar domains in the control Fgf19 MO-injected and Fgf19 MO-injected embryos at 25 hpf. Arrowheads indicate the zli. (M and N) In the Fgf19 MO-injected embryos, isl1 expression is virtually undetectable in the subpallial telencephalon and reduced in the ventral thalamus and epiphysis at 25 hpf. Lateral views with anterior to the left and dorsal to the top. Dots indicate the boundary between the telencephalon and ventral diencephalon. EXPRESSION / LABELING:
|
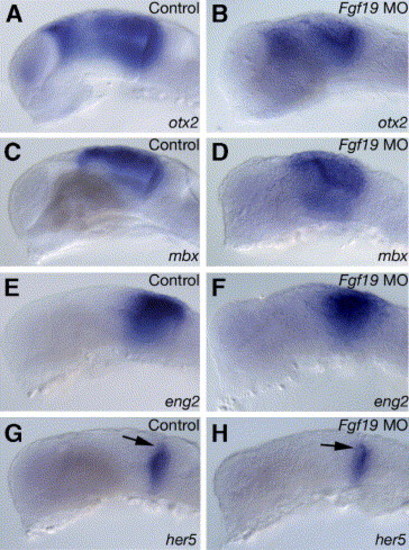
Expression of region-specific markers in the midbrain and cerebellum in the Fgf19 MO-injected embryos at 25 hpf. Embryos were injected with control Fgf19 MO (A, C, E and G) and Fgf19 MO (B, D, F and H). (A and B) In the Fgf19 MO-injected embryos, otx2 expression was detected in the dorsal thalamus and midbrain, while the expression domains were smaller in the Fgf19 MO-injected embryos than in the control Fgf19 MO-injected embryos. Furthermore, otx2 expression in the olfactory epithelium was lost. (C–F) mbx (C and D) and eng2 (E and F) were expressed in similar regions in the control Fgf19 MO-injected and Fgf19 MO-injected embryos, while the expression domains were smaller in the Fgf19 MO-injected embryos than in the control Fgf19 MO-injected embryos. (G and H) Expression of her5 in the MHB was normal in the Fgf19 MO-injected embryos. Lateral views with anterior to the left and dorsal to the top. Arrows in panels G and H indicate the MHB. EXPRESSION / LABELING:
|
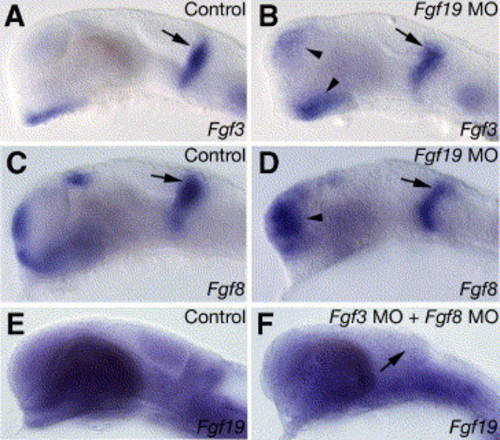
Interactions between Fgf19, Fgf3 and Fgf8 in the forebrain and midbrain. (A–D) Embryos were injected with control Fgf19 MO (A and C), Fgf19 MO (B and D) at 25 hpf. In the Fgf19 MO-injected embryos, Fgf3 (A and B) and Fgf8 (C and D) were expressed normally in the MHB (arrows) but the expression of Fgf3 and Fgf8 was up-regulated in the forebrain (arrowheads). (E and F) Fgf19 expression in embryos injected with standard control MO (E), and Fgf3 MO and Fgf8 MO (F) at 25 hpf. (E) In the embryos injected with standard control MO, Fgf19 was normally expressed. (F) In the embryos injected with both Fgf3 MO and Fgf8 MO, Fgf19 expression in the forebrain was unaffected, while that in the midbrain (arrow) decreased. Lateral views with anterior to the left and dorsal to the top. EXPRESSION / LABELING:
|
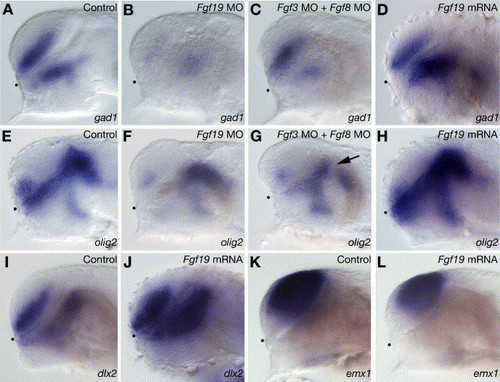
Specification of GABAergic interneurons and oligodendrocytes. (A–D) gad1 expression in wild-type embryos (A) and embryos injected with Fgf19 MO (B), Fgf3 MO and Fgf8 MO (C) or Fgf19 mRNA (D) at 28 hpf. (B) The injection of Fgf19 MO resulted in a severe reduction of gad1 expression in both the ventral telencephalon and nTPOC. (C) In the embryos injected with both Fgf3 MO and Fgf8 MO, gad1 expression in the nTPOC was severely reduced, while that in the ventral telencephalon decreased slightly. (D) The injection of Fgf19 mRNA resulted in increased expression of gad1 in the forebrain. (E–H) olig2 expression in wild-type embryos (E) and embryos injected with Fgf19 MO (F), Fgf3 MO and Fgf8 MO (G) or Fgf19 mRNA (H) at 28 hpf. (F) In the embryos injected with Fgf19 MO, olig2 expression in the dorsal thalamus was unaffected, while that in the subpallial telencephalon and ventral thalamus decreased significantly. (G) In the embryos injected with both Fgf3 MO and Fgf8 MO, olig2 expression in the subpallial telencephalon, anterior ventral thalamus and zli (arrow) was reduced, while that in the posterior ventral thalamus and dorsal thalamus was unaffected. (H) In the embryos injected with Fgf19 mRNA, olig2 expression in the forebrain increased significantly. (I and J) dlx2 expression in wild-type embryos (I) and embryos injected with Fgf19 mRNA (J) at 26 hpf. (J) The injection of Fgf19 mRNA resulted in increased expression of dlx2 in the telencephalon and diencephalon. (K and L) emx1 expression in wild-type embryos (K) and embryos injected with Fgf19 mRNA (L) at 26 hpf. (L) The injection of Fgf19 mRNA resulted in decreased expression of emx1 in the telencephalon. Lateral views with anterior to the left and dorsal to the top. Dots indicate the boundary between the telencephalon and ventral diencephalon. EXPRESSION / LABELING:
|
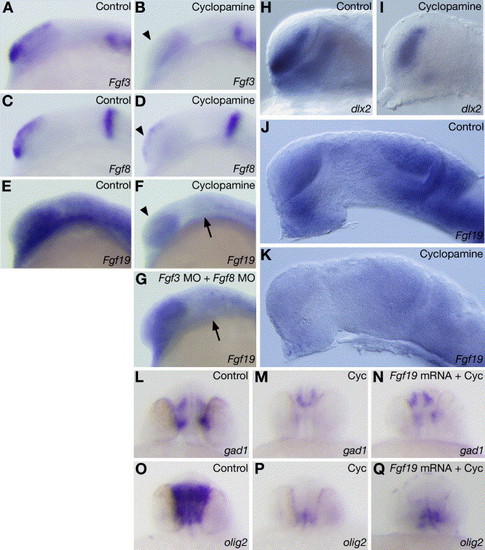
Regulation of Fgf19, Fgf3 and Fgf8 by Hh signaling. (A–D) Expression of Fgf3 (A and B) and Fgf8 (C and D) in embryos treated with 0 μM (A and C) or 100 μM (B and D) cyclopamine at 15 hpf. The treatment of wild-type embryos with 100 μM cyclopamine did not affect Fgf3 and Fgf8 expression in the MHB, while the expression of Fgf3 and Fgf8 in the telencephalon (arrows) was markedly reduced. (E–G) Fgf19 expression in wild-type embryos (E), embryos treated with 100 μM cyclopamine (F) and embryos injected with Fgf3 MO and Fgf8 MO (G) at 15 hpf. (F) Fgf19 expression in the cyclopamine-treated embryos was reduced in the forebrain (arrowhead), midbrain (arrow) and cerebellum. (G) In the embryos injected with both Fgf3 MO and Fgf8 MO, Fgf19 expression in the forebrain was unaffected, while that in the midbrain (arrow) decreased. (H–K) Expression of dlx2 (H and I) and Fgf19 (J and K) in embryos treated with 0 μM (H and J) or 100 μM (I and K) cyclopamine at 25 hpf. (H and I) The treatment of wild-type embryos with 100 μM cyclopamine strongly reduced dlx2 expression in the ventral thalamus. (J and K) Fgf19 was normally expressed in the control embryos (J), while Fgf19 expression in the cyclopamine-treated embryos was extremely reduced in the forebrain, midbrain and cerebellum (K). Lateral views with anterior to the left and dorsal to the top. (L and M) Expression of gad1 in embryos treated with 0 μM (L) or 50 μM (M) cyclopamine. The treatment of wild-type embryos with 50 μM cyclopamine strongly reduced gad1 expression in the telencephalon and lost gad1 expression in the diencephalon at 28 hpf. (N) Expression of gad1 in embryos injected with Fgf19 mRNA and treated with 50 μM cyclopamine. The expression of gad1 in the telencephalon and diencephalon was rescued by injection of Fgf19 mRNA at 28 hpf. (O and P) Expression of olig2 in embryos treated with 0 μM (O) or 50 μM (P) cyclopamine. The treatment of wild-type embryos with 50 μM cyclopamine strongly reduced olig2 expression in the forebrain at 28 hpf. (Q) Expression of olig2 in embryos injected with Fgf19 mRNA and treated with 50 μM cyclopamine. The expression of olig2 in the forebrain was rescued by injection of Fgf19 mRNA at 28 hpf. Frontal views with dorsal to the top. EXPRESSION / LABELING:
|

Unillustrated author statements EXPRESSION / LABELING:
|
Reprinted from Developmental Biology, 288(1), Miyake, A., Nakayama, Y., Konishi, M., and Itoh, N., Fgf19 regulated by Hh signaling is required for zebrafish forebrain development, 259-275, Copyright (2005) with permission from Elsevier. Full text @ Dev. Biol.