
- Title
-
Combinatorial activity of Flamingo proteins directs convergence and extension within the early zebrafish embryo via the planar cell polarity pathway
- Authors
- Formstone, C.J., and Mason, I.
- Source
- Full text @ Dev. Biol.

Phylogenetic relationship and embryonic expression of zFmi1 genes. (A) Phylogenetic relationship of zFmi1a and zFmi1b to other flamingo proteins. Estimated evolutionary distance is proportional to line length and numbers indicate confidence. These indicate that both zFmi1a genes are orthologues of the ancestral Fmi1/Celsr1 gene. Sources of predicted protein sequences: zFmi1a and zFmi1b, this study; chick Fmi1/Celsr1 and Fmi3/Celsr3; murine Celsr1, 2 and 3, GenBank accession numbers NM009886, AF031573, AF427498. (B–S) Temporal and spatial expression of zfmi1a and zfmi1b. (B and O) RT-PCR analysis of zfmi1a and zfmi1b expression, respectively (top panel). MW is indicated. Control is EF1α lower panel). (C–N) Wild-type embryos hybridized for zfmi1a at 30% epiboly (C), 40% epiboly (D), shield (E), 65% epiboly (F), 75% epiboly (G and H), 95% epiboly (I and J), 3 somites (K and L), and 6 somites (M and N). Lateral and dorsal views are as indicated on each plate; dorsal is to right and anterior to top, respectively. (H, L, and N) Dorsal views of flat-mounted embryos; anterior is to the top. (E) Arrow indicates expression of zfmi1a in shield. Arrowhead indicates expression of zfmi1a in lateral germ ring. Inset, lateral view; arrow indicates expression of zfmi1a in shield. (H) Small black arrow indicates enriched zfmi1a expression in axial tissue, larger arrow indicates an isolated lateral cell expressing zfmi1a. Arrowhead indicates expression of zfmi1a in head. (J) Inset, dorsal view of animal pole; arrow indicates loss of zfmi1a expression medially. (L) Arrowhead indicates loss of zfmi1a expression within anterior axial tissue, white arrow indicates expression in eye field and black arrow indicates expression within lateral trunk. (P–S) Expression of zfmi1b at sphere (P), shield (Q), 95% epiboly (R), and 16 somite stages. Abbreviations: E, epiboly; s, number of somites. |
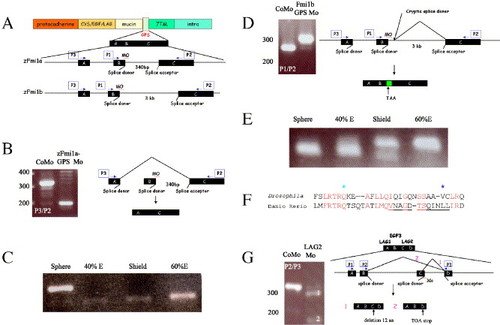
Generation of splicing defects in the GPS and LamG2 domains of Flamingo proteins. (A) Schematic representation of the Flamingo1 protein and morpholino-induced mis-splicing of the GPS domain. The GPS domain (pale green box) is encoded by three exons: A, B, and C. Position of morpholinos (MO) designed against targeted donor splice sites are indicated. Two sets of PCR using primer combinations P1/P2 and P3/P2 (blue arrows in cartoon) were used to assess mis-splicing. Abbreviations: Cys/EGF/LAG, cysteine-rich, EGF, and LamG2 domains; mucin is the serine/threonine-rich region; 7TM, seven-pass transmembrane domain; intra, intracellular domain. (B and C) Analysis of defective splicing in F1a-GPS1 morphants. (B) RT-PCR with primers P3 and P2 (blue arrows). Amplification of a smaller RT-PCR fragment (200 bp) than from controls (320 bp) was observed. CoMo is F1a-GPS1 morpholino but with four non-clustered, single nucleotide changes. Molecular weight markers (bp) are indicated to the left. Due to exon skipping, primers P1/P2 failed to amplify a band. Schematic representation of exon skipping induced by F1a-GPS is shown to the right. (C) Timing of onset of zFmi1a GPS domain splicing defect during embryogenesis. E is epiboly. (D and E) Analysis of defective splicing generated by injection of F1b-GPS1 morphants. (D) RT-PCR with primers P1, P2 is shown (blue arrows), primers P3/P2 amplified similar pattern of bands. RT-PCR of F1b-GPS1 morphant embryos amplified a larger band (310 bp) than controls (280 bp) due to use of a cryptic splice site that incorporated an extra 40 bp of intronic sequence into zFmi1b mRNA (indicated by green box). CoMo is F1b-GPS1 morpholino but with four nucleotide changes. Molecular weight markers (bp) are indicated to left of each gel. Schematic representation is shown to the right. (E) Timing of onset of the zFmi1b GPS domain splicing defect during embryogenesis, E is epiboly. (F and G) Imitation of Drosophila Flamingo PCP mutations using morpholino-induced mis-splicing. (F) Comparison of amino acid sequence from LamG2 in Drosophila melanogaster Flamingo and zFmi1a. Genomic sequence for zFmi1a was derived from ZFIN. Conserved amino acids are highlighted in red. Position of Drosophila mutation, Q1838 to stop, is marked by a pale blue star and mutation, V1849 to D, is marked by a dark blue star. 12 amino acid deletion induced by LamG2 morpholino is underlined. (G) Analysis of defective splicing generated by injection of F1a-LamG2 morpholino into zebrafish embryos. RT-PCR analysis utilized primers P3 and P2 (blue arrows), primers P1, P3 amplified a similar pattern of bands. Molecular weight markers (bp) are indicated to left of gel. Schematic representation of defective splicing within zFmi1a LamG2 domains induced by injection of LamG2 morpholino is shown to the right. The LAG1/EGF3/LAG2 domain, part of the pale orange box in (A), is encoded by four exons, A encodes C-terminal of LamG1, B encodes EGF3, C plus D encode N-terminal part of LamG2. Two mis-spliced products were resolved on the gel: (1) indicates the largest and most predominant of these resulting from use of a cryptic splice site within exon C, 36 bp upstream of the original acceptor site that deleted 12 amino acids from the LamG2 domain; (2) indicates smaller and less abundant product resulting from exon-skipping event that truncates the protein within the LamG2 domain. |
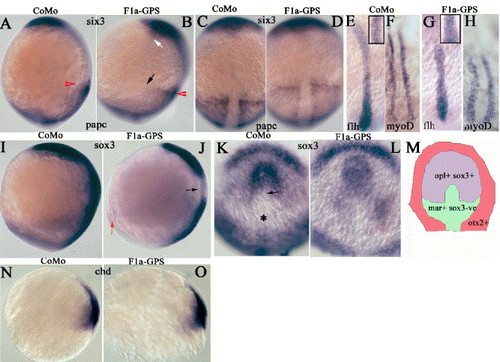
F1a-GPS1 morphant embryos display defects in convergence and extension at the end of gastrulation. Whole-mount in situ hybridization of tailbud to 1-somite stage embryos (A–L) and 75% epiboly (N and O) following injection with F1a-GPS1 or F1a-GPS1 morpholino with four nucleotide changes (CoMo). Gene probes are as indicated on the plates. (A, B, I, and J) Lateral view; dorsal is to right. (C–H, K, and L) Dorsal view; anterior is to top. (N and O) Lateral view, animal pole is up and dorsal is to the right. (A–D) Red arrowheads mark the anterior limit of papc expression highlighting the shortened trunk; black and white arrows indicate lateral extent of papc and six3 expression, respectively. papc; paraxial protocadherin. (E–H) Insets are magnified views to show flh domain width. flh; floating head. (J) Black arrow indicates absence of sox3 expression within part of the developing head, red arrow indicates reduced ventral sox3 expression. (K) An asterisk indicates sox-3-negative domain and the arrow indicates a sox3-negative area intruding into the sox3-positive retinal field. (M) Schematic representation of marker gene expression within the anterior neural plate based upon data from Varga et al. (1999). The retinal domain (mauve) expresses odd-paired-like (opl) and sox3, ventral diencephalon (green) expresses mar (forkhead 3; Moens et al., 1996 and Odenthal and Nusslein-Volhard, 1998) and is sox3-negative. Surrounding domains (pink) express otx2 (N and O); chd, chordin. EXPRESSION / LABELING:
|
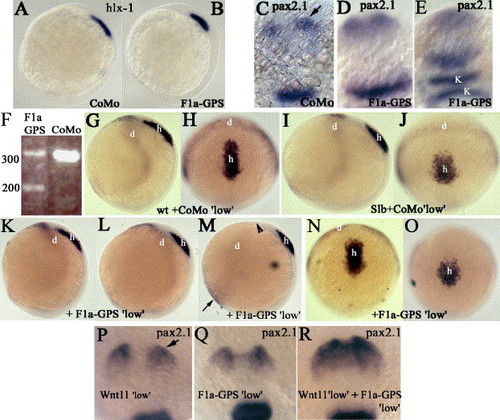
zFmi1a functions in prechordal plate migration in concert with Slb/Wnt11 and in convergence of the neural plate. Whole-mount in situ hybridization markers are as indicated on the plates, (A, B, G–O) bud stage, (C–E) 10-somite stage, (P–R) and 12-somite stage. (A and B) Lateral views, dorsal is to right. (C–E) Dorsal views, anterior is to top. (C) pax2.1 in optic stalk is marked by an arrow. K is krox20 expression in panel E. (F) Titration of F1a-GPS1 morpholino to generate 50% wild-type and 50% mis-spliced pre-mRNA at 3 μg/ml. CoMo is F1a-GPS1 morpholino but with four nucleotide changes. Molecular weight markers (bp) are indicated. (G–O) Embryos were derived from crossing of Slb heterozygotes and injected with either CoMo (same as in F) at 3 μg/ml (G–J) or F1a-GPS at 3 μg/ml (K–O). (G, I, K–M) Lateral views, dorsal is to right. (H, J, N, and O) Dorsal views, anterior is to top. (M) Arrowhead indicates loss of dlx-3 expression in dorso-lateral neural plate and black arrow indicates broader and more intense expression of dlx3 within the ventro-lateral neural plate. (P–R) Wild-type embryos injected with morpholinos as indicated. Dorsal view of head, anterior is to top. (P) Arrow indicates pax2.1 expression within optic stalk, (Q) F1a-GPS1 at 3 μg/ml. (R) Double morphants, F1a-GPS1 (3 μg/ml) plus Wnt11 morpholino. EXPRESSION / LABELING:
|

Continued requirement for zFmi1a during early segmentation stages: failure to elevate the neural keel. (A–H) 3-somite stage, (I, J, M–P) 7-somite stage, and (K and L) 10-somite stage. In lateral views, dorsal is to the right and in dorsal views, anterior is up. Marker genes are as indicated on the plates. (A–D) Convergence of paraxial and lateral mesoderm and neural plate is delayed in F1a-GPS1 morphants. Abbreviations: px; pax2.1, k; krox20. (B) Arrow indicates correct width of axial domain. (E–H) Convergence of the axial domain from F1a-GPS1 morphants subsequently becomes identical to controls (F1a-GPS1 morpholino but with four nucleotide changes). (E and F) Optical sections, dorsal is up; shh, sonic hedgehog. (J) Arrow indicates loss of posterior pax2.1 expression. (L) Arrow indicates loss of myoD expression within lateral somites. Representative embryo displaying both reduced and absent expression of myoD, embryo has been overstained to detect weak expression. Morphants displaying greatest impairment of convergence and extension exhibited complete absence of myoD in anterior somites. (M–P) Defective convergence of neuroepithelium disrupts morphogenesis of notochord; shh, sonic hedgehog. (O and P) optical sections; dorsal is to top, hashed lines mark the boundary between neural keel/plate and somitic domain. EXPRESSION / LABELING:
|
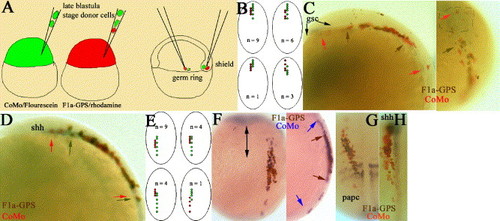
zfmi1a acts cell-autonomously in axis extension but is not required for dorsal convergence. (A) Schematic representation of transplantation experiments. Donor F1a-GPS1 and CoMo (F1a-GPS1 morpholino but with four nucleotide changes) cells were transplanted simultaneously into the deep cells of the shield or into the germ ring of wild-type shield stage hosts. Only those embryos in which CoMo donor cells had extended extensively within the embryo were considered for analysis, n = 37/60. (B and E) Schematics of the four different types of donor cell movement observed. Dorsal view of 1–3 somite embryos. Red dots: the A-P extension of F1a-GPS1/rhodamine-injected cells; green dots: CoMo/Fluorescein-injected cells. (B) Results of transplants into shield, (E) results of transplants into germ ring. (C, D, F–G) Donor cell transplants into deep cells of shield (C, D) or germ ring (F–G). Representative embryos following whole-mount in situ hybridization and immunostaining. Gene markers are as indicated on the plates. Color of donor cell staining is as indicated on the plates and arrows indicate the limit of extension of each donor population type using the same color coding. (C) Left panel, 3-somite embryo; lateral view of head, anterior is to the left. During immunostaining procedure, posterior prechordal gsc expression has been lost. Right panel, dorsal view showing rostral edge of same embryo, anterior is to top. gsc expression domain within polster is indicated by dashed lines. Arrows indicate rostral boundaries of cell movement (D) 1-somite embryo, lateral view of head. (F) 1-somite embryo, left panel; dorsal view, arrow indicates position of midline. Right panel, lateral view (G and H) Dorsal views of 3-somite embryos. |

Zebrafish Fmi1a and Fmi1b proteins co-operate to control cell movement. (A–C, I, J) 10-somite embryos. (E, F, H, L–N) 3-somite embryos. In all dorsal views, anterior is to the top. In all lateral views, dorsal is to the right. Markers are as indicated, px is pax2.1, k is krox20, papc is paraxial protocadherin. (A–C) F1b-GPS1 morphants exhibit undulation of neuroepithelium and tailbud. (D and K) RT-PCR analysis. Titration of F1b-GPS1 (D) and F1a-LamG2 (K) morpholino. CoMo is F1b-GPS or F1a-LamG2 morpholino but with four nucleotide changes. Molecular markers (bp) are indicated to left of gel. (D) 3 μg/ml F1b-GPS1 morpholino generates approximately 65% wild-type and 35% mis-spliced product. P1/P2 indicates primer pair used in PCR (see Fig. 2A). (K) 5 μg/ml F1a-LamG2 morpholino generates approximately 40% wild-type and 60% mis-spliced product. P2/P3 indicates primer pair used in PCR (see Fig. 2G). (E–I) Double morphant embryos. (E) Injection of 2.4 μg/ml and 3.5 μg/ml CoMos for F1a-GPS1 and F1b-GPS1, respectively. (F) Injection of 2.4 μg/ml F1a-GPS1 and 3.5 μg/ml F1b-GPS1. (G) F1a-GPS1 (3 μg/ml) and F1b-GPS1 (3.5 μg/ml) morphant. (H) F1a-GPS1 (4 μg/ml) and F1b-GPS1 (4 μg/ml) morphant. Black arrowhead: mid-hindbrain pax2 expression; white arrow: papc expression; black arrow: pronephric pax2 expression. (I) F1a-GPS1 (2.4 μg/ml) and F1b-GPS1 (3.5 μg/ml) morphant. View of head, arrow indicates pax2.1 expression in optic stalk. (J) 9-somite embryo. (L–M) Double morphant embryo, (L) F1a-GPS1 (2.4 μg/ml) and F1a-LamG2 (4.5 μg/ml). (M) F1a-LamG2 (4.5 μg/ml) and F1b-GPS1 (3.5 μg/ml). EXPRESSION / LABELING:
|
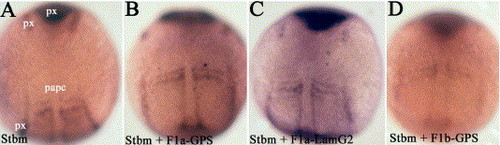
Zebrafish flamingo1 proteins interact with stbm to control cell movement. (A–D) pax2.1 (px) and papc expression at the 3-somite stage. Dorsal views, anterior to the top. (A) 2 μg/ml stbm morpholino, (B) 2 μg/ml stbm morpholino and 3 μg/ml F1a-GPS1, (C) 2 μg/ml stbm morpholino and 4.5 μg/ml F1a-LamG2, (D) 2 μg/ml stbm morpholino and 3.5 μg/ml F1b-GPS1. |
Reprinted from Developmental Biology, 282(2), Formstone, C.J., and Mason, I., Combinatorial activity of Flamingo proteins directs convergence and extension within the early zebrafish embryo via the planar cell polarity pathway, 320-335, Copyright (2005) with permission from Elsevier. Full text @ Dev. Biol.