
- Title
-
Mutations in half baked/E-cadherin block cell behaviors that are necessary for teleost epiboly
- Authors
- Kane, D.A., McFarland, K.N., and Warga, R.M.
- Source
- Full text @ Development

Phenocopies of hab allele-specific traits by disruption of EC1 or EC4. (A) Injection of morpholino oligonucleotide MO1 into wild-type embryos at increasing doses mimics the epiboly arrest phenotype. (B) Phenotype of habdtv43/dtv43 at equivalent stage. (C) Aberrant splice products caused by MO1 appear at doming, shortly after the beginning of zygotic transcription (Kane and Kimmel, 1993). Arrow indicates maternal product. (D) Splicing event caused by MO1 (black bar) and conceptual protein, inferred by sequencing RT-PCR product using the primers indicated by arrows in exon8 and exon11. (E) Injection of MO2 into wild-type embryos at increasing doses causes a severe epiboly arrest, uneven radial intercalation (arrow) and dissociation of the blastoderm (arrowhead). (F) Injection of MO2 into wild-type embryos at low doses mimics the ZMD trait. Embryos are shown at the 5-somite stage and the detached cell region is shown beneath at higher magnification. (G) Phenotype of ZMD habtm94/+. (H) Splice products caused by MO2. (I) Splicing event caused by MO2 and the conceptual protein, as inferred by sequencing the RT-PCR product using the primers indicated in exon4 and exon 12. |
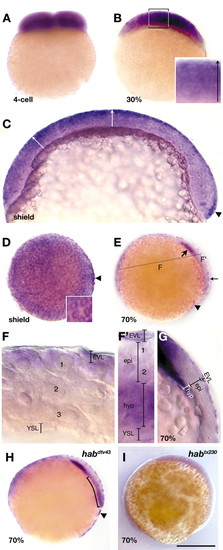
Whole-mount in situ hybridization show that hab expression becomes progressively restricted to superficial layers of the blastoderm. (A) Optical cross-section of 4-cell stage. (B) Hand-section of 30% epiboly stage. Inset, higher magnification of boxed region showing a radial gradient (arrow) of hab expression in the epiblast, highest superficially. (C) Medial sagittal section of shield stage embryo, dorsal to the right. Arrows indicate the gradient of hab expression on the ventral side and at the animal pole. Note clearing on dorsal side, except for the thin line of expression in the EVL. Arrowhead indicates region of intense hab expression in the forerunner precursors. (D) Animal pole view of shield stage embryo showing high levels of hab expressed in the EVL, and the intense expression in the forerunner cells (arrowhead). Inset shows higher power view, showing nuclei surrounded by rings of hab expression (E) Medial sagittal section at 70% showing high levels of hab expressed in the anterior axial hypoblast (thick arrow), the EVL (thin arrow), and the forerunner cells (arrowhead), and absence of hab expression in the axial epiblast. (F,F′) High magnification views of embryo in E. Hand sections are along plane indicated by dashed line in E. (F) Lateral transverse section, showing a radial gradient of hab expression in the epiblast, highest in superficial layer adjacent to the EVL. At this location, the hypoblast has not yet moved under the epiblast. The numbers indicate approximate layers. (F′) Dorsal transverse section, showing absence of hab expression in axial epiblast cells, and strong expression in anterior axial hypoblast near the level of the prechordal plate. At this stage, the midline of the neural epithelium is about two cells thick. (G) Medial sagittal section at 70% over stained to show the expression in the EVL, and the clearing in the axial epiblast. (H) Optical cross-section of 70% epiboly habdtv43/dtv43 missense mutant showing raised levels of hab mRNA found in the blastoderm. Note intense expression in the forerunner clusters (arrowhead). Curved bracket indicates heightened expression in the hypoblast. Embryos in H and E are siblings. (I) Optical cross-section of 70% epiboly habtx230/tx230 nonsense mutant showing lowered levels of hab mRNA found in the embryo. epi, epiblast; hyp, hypoblast; YSL, yolk syncytial layer. Numbers indicate cell layers of the epiblast. Scale bar: 100 µm in C; 20 µm in F,F′; 75 µm in G; 250 µm in all others. |
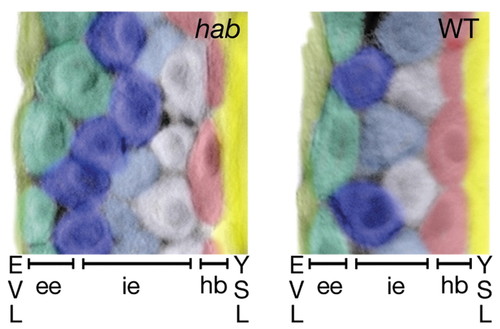
Cell shape asymmetry and organization of the epiblast layer in hab mutants and wild-type embryos at 90% epiboly, showing Nomarski DIC photomicrographs of transverse sections of the lateral equator of fixed embryos stained with anti-ß-catenin. Cells are pseudo-colored to distinguish cells and layers are labeled at the bottom of the figure. At this stage, the mesoderm is only one cell layer thick, and endoderm cells have moved out of the plane of the section (Warga, 1999). ee, exterior layer of the epiblast layer; hb, hypoblast layer; ie, interior layer of the epiblast layer; YSL, yolk syncytial layer. |
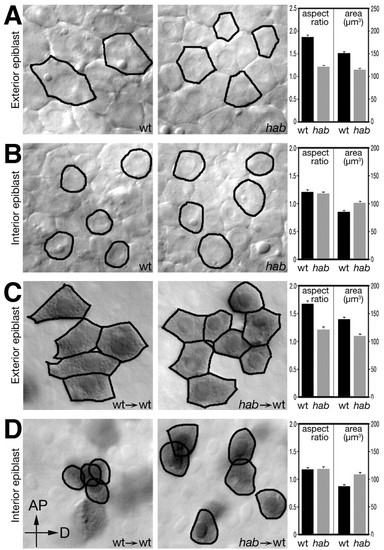
Epiblast cells require hab to exhibit cell shape changes in a cell-autonomous manner. Optical sections through the exterior (A) and interior (B) layers of the epiblast of live wild-type and homozygous mutant hab embryos at 80% epiboly. Average aspect ratio (length/width) and surface area of wild-type and mutant cells were compiled from the outlines of cells (20-25 cells/embryo) for each layer in a total of three wild-type and four mutant embryos. Cell-autonomous effect of hab on cell shape in the exterior (C) and interior (D) layers of the epiblast. Wild-type or mutant cells were transplanted into the epiblast of a wild-type host and analyzed at the 80% epiboly stage. Transplanted cells are brown due to a fixable tracer. Data was compiled from outlines of donor cells (20-25 cells/host embryo) in a total of 15 chimeras, eight with cells from a wild-type donor and seven with cells from homozygous mutant hab donors. Note that aspect ratios and surface area of transplanted cells are almost identical to their live wild-type and mutant counterparts. Panels are orientated with the animal pole (AP) to the top and dorsal (D) to the right. |
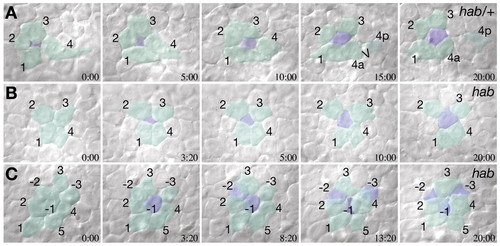
Radial intercalation in heterozygous and recessive hab mutants. Selected frames from time-lapse video recordings of the lateral epiblast at about 80% epiboly using Nomarski DIC optics. Cells are pseudo-colored by layer and individual cells are identified by numbers. In both ZMD heterozygous (A) and homozygous hab mutants (B), cells from the interior layer of the epiblast (blue) intercalate in among cohorts of cells of the exterior layer (green). (C) In homozygous hab mutants, cells frequently leave the exterior layer. Three exterior cells (green with negative numbers), sequentially move to the interior layer of the epiblast (color shift to blue), and disappear under the neighboring exterior layer cells. |
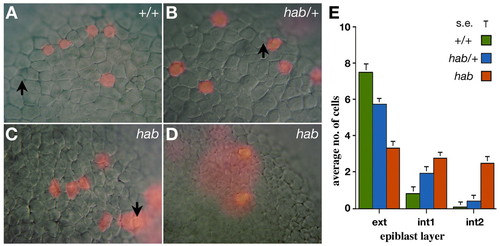
Epiblast cells require hab to maintain superficial positions in the epiblast. Progeny of a single superficial cell labeled near the animal pole at the 4000-cell stage visualized at 80% epiboly in live homozygous mutants, ZMD mutants and wild-type siblings. (A) Clone in a wild-type embryo, in which all epiblast cells are located in the exterior layer. Note epithelial cell morphology of unlabeled cells. (B) Clone in a ZMD mutant, in which all epiblast cells are located in the exterior layer. (C) Rare clone in a homozygous hab mutant, in which the majority of epiblast cells are located in the exterior layer. Note the loose cell morphology of unlabeled cells. (D) Typical clone in a homozygous hab mutant, in which the majority of epiblast cells are located in the interior layer. (E) Distribution of clonal progeny in the epiblast layers of homozygous mutants, ZMD mutants and wild-type embryos. Arrows indicate examples of the large nuclei of EVL cells; diffuse staining (in D) is from thin cells of the EVL portion of the clone. |