
- Title
-
Enhancer trapping in zebrafish using the Sleeping Beauty transposon
- Authors
- Balciunas, D., Davidson, A.E., Sivasubbu, S., Hermanson, S.B., Welle, Z., and Ekker, S.C.
- Source
- Full text @ BMC Genomics
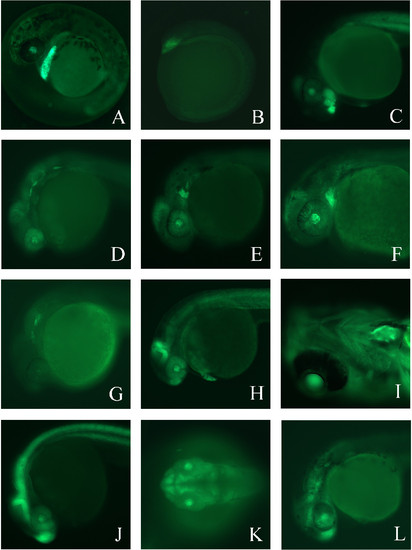
Enhancer trap lines exhibit a variety of unique GFP expression patterns. (A). Lateral view of GFP expression in Enhancer Trap line 1 (ET1) at 38 hours post fertilization (hpf). (B) ET3 at 5–6 somite stage. (C) ET3 at 36 hpf. (D) ET4 at 26 hpf. (E) ET5 at 30 hpf. (F) ET5 at 48 hpf. (G) ET6 at 26 hpf. (H) ET7 at 32 hpf. (I) Ventral view of ET7 at 5 dpf. (J) Lateral view of ET8 at 26 hpf. (K) Dorsal view of ET9 at 28 hpf. (L) Lateral view of ET9 at 30 hpf. In all panels, anterior is to the left. See text for details. EXPRESSION / LABELING:
|
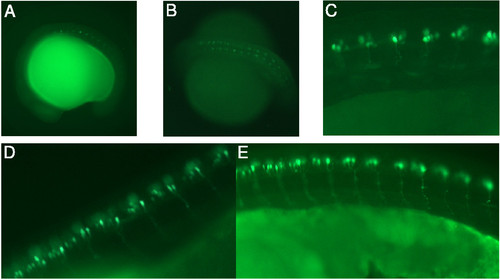
The ET2 transgenic fish line expresses GFP in caudal primary motoneurons. GFP expression in ET2 was visualized in motoneurons using a bandpass GFP filter set at various stages of embryonic development. In all panels anterior is to the left. (A) The onset of GFP expression in ET2 line at 16 somite stage. (B) 26 somite stage. (C) 24 hpf. (D, E) 36 hpf. Axonal trajectories are visible at 24 and 36 hpf. EXPRESSION / LABELING:
|

Identification of the transposition event in the ET2 line. (A) The pT2/S2EF1α transposon insertion into zebrafish genome is shown; restriction enzyme sites and primers used for molecular analysis are indicated. Transposon IR/DR's are shown as solid boxes with open triangles, and the GFP open reading frame is shown as a grey arrow. Genomic DNA is shown as a dotted line. N is NsiI, E is EcoRV. (B) Southern blot on ET2 line outcross embryos. DNA from GFP positive (lanes 1 and 2) and GFP negative (lanes 3 and 4) embryos was digested with NsiI (lanes 1 and 3) or EcoRV (lanes 2 and 4) and probed with a GFP-specific probe. (C) Linkage of the transposon insertion event to GFP expression. Primers flanking the transposon insertion event (arrows) were used to conduct PCR on DNA from GFP positive (lane 2) and GFP negative (lane 3) embryos from an ET2 outcross different from the one used in (B). Lane 1, λ Eco47III Marker (Fermentas Inc). |
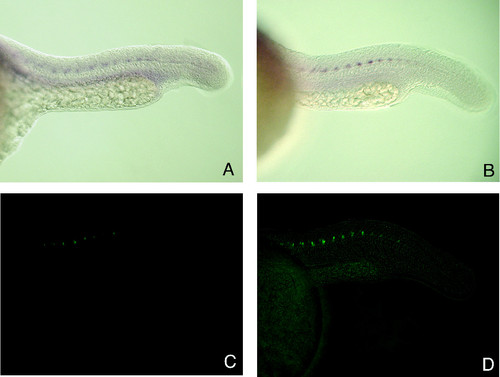
GFP expression in ET2 line embryos is indistinguishable from endogenous PARG gene expression. 23 hpf embryos collected from a heterozygous outcross were photographed for GFP fluorescence and sibling embryos were fixed for in situ hybridization. (A) In situ hybridization with PARG antisense probe. (B) In situ with GFP antisense probe. (C) Visualization of GFP expression in living embryos using a bandpass GFP filter set. (D) The same embryo as in (C) photographed using a bandpass GFP filter set with a low level of bright field illumination to visualize GFP expression in relative position to the somites. EXPRESSION / LABELING:
|

GFP expression in ET7 line matches mkp3 mRNA expression. (A) GFP fluorescence photograph of an ET7 embryo at 23 hpf. (B) In situ hybridization on 23 hpf wild type embryo using mkp3 antisense RNA probe. EXPRESSION / LABELING:
|

Unillustrated author statements EXPRESSION / LABELING:
|