
- Title
-
RETRACTED: Annexin 2-caveolin 1 complex is a target of ezetimibe and regulates intestinal cholesterol transport
- Authors
- Smart, E.J., De Rose, R.A., and Farber, S.A.
- Source
- Full text @ Proc. Natl. Acad. Sci. USA
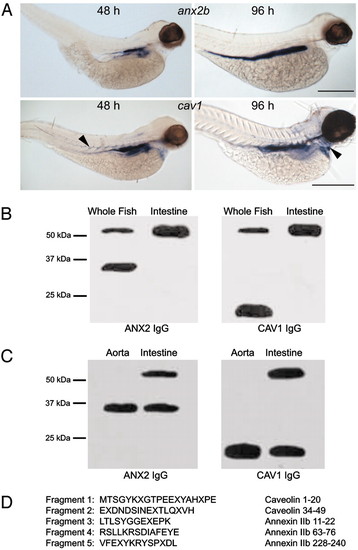
CAV1 and ANX2b can form a stable heterocomplex. (A) Expression of cav1 and anx2b in zebrafish larvae. Embryos were fixed in 4% paraformaldehyde and probed with digoxigenin-labeled antisense RNA as described in ref. 19. (Upper) Lateral views of embryos probed for anx2b at 48 hpf (Left) and 96 hpf (Right). Note strong expression in the intestinal epithelium. (Scale bar, 500 μm.) (Lower) Lateral views of embryos probed for cav1 at 48 hpf (Left) and 96 hpf (Right). Expression is concentrated in the intestinal epithelium, but cav1 can also be seen in the somite boundaries at 48 hpf (Left, arrowhead) and in the heart ventricle at 96 hpf (Right, arrowhead). (Scale bar, 500 μm.) (B) Identification of a CAV1–ANX2b heterocomplex. Equal amounts of protein (20 μg) isolated from adult fish or adult fish intestine were resolved by SDS/PAGE and immunoblotted with ANX2 IgG or CAV1 IgG. The data are representative of five independent experiments. (C) Equal amounts of protein (20 μg) isolated from the aorta or intestine of C57BL/6 mice were resolved by SDS/PAGE and immunoblotted with ANX2 IgG or CAV1 IgG. The data are representative of three independent experiments. (D) The ≈55-kDa band was subjected to IP from adult intestine by using CAV1 IgG as described in ref. 11 and resolved by SDS/PAGE. The 55-kDa band was recovered from the gel and digested with trypsin; the resulting fragments were resolved by SDS/PAGE and transferred to nylon membrane. Five of the fragments were sequenced by mass spectrometry. The sequence of each fragment is shown along with the region to which they correspond in CAV1 or ANX2b. The letter "X" signifies an unidentified amino acid residue. |
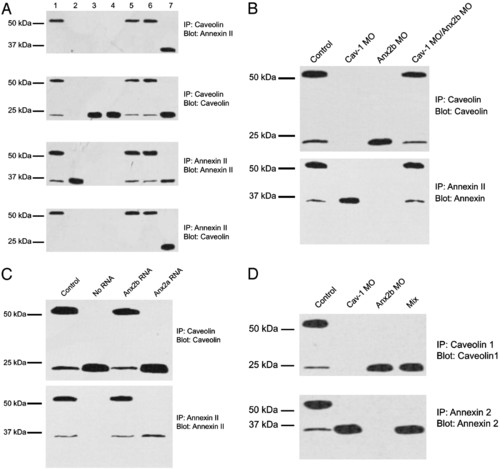
Disruption and reformation of the CAV1–ANX2b heterocomplex. (A) Effect of cav1 and anx MO on the formation of the CAV1–ANX2b heterocomplex. Embryos (1–8 cell stage) were injected with the following MO: uninjected (lane 1), cav1 (lane 2), anx2b synthesis 1 (lane 3), anx2b synthesis 2 (lane 4), anx2b mismatched (lane 5), and anx2a (lane 6). 3T3 cell lysate (20 µg) was loaded directly onto the gel as a positive control for ANX2 and CAV1 (lane 7). The embryos were then allowed to develop for 48 h. Larvae were processed to generate lysates (≈20 embryos per sample), and 50 μg of protein was used for IP with CAV1 IgG or ANX2 IgG as indicated. The precipitates were resolved by SDS/PAGE and immunoblotted with ANX2 IgG or CAV IgG as indicated. The data are representative of three to four independent experiments. (B) Reformation of the ANX2b–CAV1 complex in vitro. Embryos (1–8 cell stage) were injected with either cav1 or anx2b MO or uninjected (control) and allowed to develop for 48 h. Lysates were prepared from each class of embryo, and IP were performed as in A. For the last lane, lysates from cav1 MO-injected and anx2b MO-injected embryos were mixed together and incubated at room temperature before IP. SDS/PAGE and immunoblotting are as in A.(C) Rescue of complex formation by anx2b mRNA. Embryos (1–8 cell stage) were injected with anx2b MO ("no RNA" lane) or anx2b MO plus the indicated capped mRNA (control = uninjected). The embryos were allowed to develop for 48 h. Larvae were processed to generate lysates (≈20 embryos per sample), and 50 μg of protein was used for IP with CAV1 IgG (Upper) or ANX2 IgG (Lower). The precipitates were resolved by SDS/PAGE and immunoblotted with the same IgG used for the precipitation. (D) The CAV1–ANX2b complex in embryos is not forming in vitro. Embryos (48 hpf) were collected in a 500-ml Eppendorf tube (20 embryos total per tube), the medium was removed, and the embryos were immediately frozen on dry ice. Specimens were then thawed, lysed, subjected to SDS/PAGE and immunoblotted. For the mix sample, 10 embryos each of anx2b MO-injected and cav1 MO-injected were placed in the tube and frozen as described. No complex formed in the short time that separate ANX2b-free and CAV1-free embryo lysates were mixed together. |

Effect of reducing ANX2b protein in zebrafish larvae. Newly fertilized embryos (1–8 cell stage) were injected with anx2b MO and allowed to develop. (A) Larvae (5 d postfertilization) were fed NBD-cholesterol as described (2) then photographed. Uninjected larvae concentrate NBD-cholesterol in the gall bladder (arrowhead) and intestine (arrow). (B) IP and immunoblot to determine the persistence of anx2b MO effect. Embryos were injected with anx2b MO, collected, lysed, subjected to IP, and immunoblotted as described in the legend to Fig. 2. Uninjected control embryos are 48 hpf. For the 120-h sample, embryos were fed NBD-cholesterol and sorted into low- and high-intestinal fluorescence groups before lysis and IP. Data are representative of three to five experiments with 20–30 larvae per group. (Scale bar, 500 μm.) (C) Effect of anx2b MO on lipid composition. Embryos were injected with anx2b MO, allowed to develop for 72 h, then collected. The total lipid was then collected, and the amount of cholesterol, cholesteryl ester, and triglycerides was determined for injected (open bars) and control uninjected (closed bars) embryos. Each bar represents the mean of six measurements, 20 embryos per measurement. Differences between injected and control embryos for both cholesterol and cholesteryl ester are statistically significant (P < 0.05). (D) Rescue of cholesterol by anx2b mRNA. Uninjected, anx2b MO-injected, and anx2b MO/anx2b mRNA coinjected embryos were collected at 48 hpf, and the cholesterol per embryo was determined by mass spectrometry. Each point is the average of three separate batches of 20 embryos each. The MO-injected value shows a statistically significant difference from both the uninjected and MO plus RNA values (Tukey honestly significant difference test; P < 0.01), whereas uninjected and MO plus RNA values do not show statistically significant difference from each other. (E) Immunoblot of embryos from the same experiment as D to demonstrate that rescue of cholesterol concentration by anx2b mRNA is coincident with rescue of CAV1–ANX2b protein complex. |

Effect of ezetimibe on CAV1–ANX2 complex. (A) Effects of ezetimibe on complex formation in zebrafish embryos. (Top) Immunoblot with CAV IgG. (Bottom) Immunoblot with ANX2 IgG. Lanes are identical in both blots. Embryos (48 hpf) were lysed and subjected to IP followed by SDS/PAGE (20 embryos per lane), and immunoblotted. Lane 1, CHO cells (control); lane 2, untreated embryos, IP with CAV IgG; lane 3, untreated embryos, IP with ANX2 IgG; lane 4, embryos soaked in 100 μM ezetimibe from 24 hpf to 48 hpf and subjected to IP with CAV IgG; lane 5, embryos soaked in ezetimibe as in lane 4 (IP with ANX2 IgG). (B) Immunoblots of mouse enterocytes. (Upper) Immunoblot with CAV IgG. (Lower) Immunoblot with ANX2 IgG. Lanes are identical in both blots. Ezetimibe-treated mice were administered the drug orally (1 mg⋅kg-1⋅d-1) for 4 weeks immediately before being killed (n = 12 mice per group). Mice that were either untreated or ezetimibe-treated were fasted for 4 h and killed; enterocytes were then isolated from the jejunum by the low-temperature method (31). Enterocytes were lysed, and the cytosol was subjected to IP followed by SDS/PAGE and immunoblotted with the same IgG used for precipitation. Lane 1, C57BL/6 mouse; lane 2, C57BL/6 mouse treated with ezetimibe; lane 3, LDL-receptor (LDLr) mutant mouse; lane 4, LDL-receptor mutant mouse plus ezetimibe; lane 5, C57BL/6 mouse on a Western diet; lane 6, C57BL/6 mouse on a Western diet plus ezetimibe. (C) Serum cholesterol measurements for the mice in B. (D) IP of CAV1 or ANX2 coprecipitates cholesterol. Enterocytes from C57BL/6 mice fasted for 4 h were isolated as in B and treated with 10 μM ezetimibe for 2 h at 37°C. The cytosol was subjected to IP, and the amount of cholesterol was determined by gas chromatography. (E) IP of CAV1 but not ANX2 or cyclophilin A coprecipitates ezetimibe. CACO-2 cells were treated as in D and subjected to IP; the amount of ezetimibe was determined by gas chromatography-mass spectrometry. |
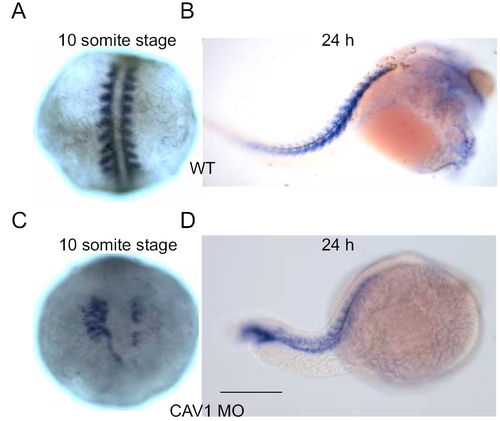
Effect of cav1 MO on embryo morphology. Uninjected and cav1 MO injected embryos were fixed at ≈10 somite stage (A and C) and 24 hpf (B and D) and subjected to whole-mount in situ hybridization for myoD, a known marker for somitic mesoderm. (A and B): Uninjected embryos. (C and D) cav1 MO-injected embryos. Embryos are shown in dorsal view, anterior to the top (A and C) and in lateral view, anterior to the right (B and D). Scale bar, 250 μm. |