- Title
-
Zebrafish SPI-1 (PU.1) marks a site of myeloid development independent of primitive erythropoiesis: implications for axial patterning
- Authors
- Lieschke, G.J., Oates, A.C., Paw, B.H., Thompson, M.A., Hall, N.E., Ward, A.C., Ho, R.K., Zon, L.I., and Layton, J.E.
- Source
- Full text @ Dev. Biol.
|
A zebrafish spi1 orthologue. (A) Comparison of functional domains of SPI.1 proteins from four species, showing amino acid identity scores for each of the three functional domains. In the box linear diagrams, numbers above domain boxes indicate the last residue of each functional domain, and numbers within indicate the percent identity to zebrafish spi1. (B) Phylogenetic analysis for amino acids demonstrates that D. rerio spi1 is an orthologue of previously described SPI.1 genes, and that the related gene family members SPI-B and SPI-C form separate clades. [GenBank GI (or Accession) numbers, top to bottom: 4507175, 6755473, 8745406, 2369863, 11245497, (AF321099), 8745412, 36562, 2586116, 8745407, 8745409, 11245499, 8745404, 8745414, 11245501, 6755618, 4557551]. The analysis was based over the DNA binding domain for all proteins commencing at the sequence GX(R/K)(R/G/K)(K/R)XR in all but human ELF5, for which the sequence starting “TSLQSS” was used. The dendrogram was constructed by using ClustalX and Treeview building on the analysis of Spi family DNA-binding domains given in Shintani et al. (2000) and Anderson et al. (2001) using human ELF-5 as an outgroup. Bootstrap values (n = 1000) are indicated at nodes as percents. (C) Only one spi1 gene exists in the zebrafish genome. Southern analysis of zebrafish genomic DNA digested with a various restriction enzymes (Lanes: 1, EcoRI; 2, BamHI; 3, BglII; 4, PstI; 5, XbaI; 6, SmaI) and hybridized to a radiolabeled probe corresponding to either the entire 1034 nucleotides (Probe A) or the first 367 nucleotides (Probe B) of the zebrafish spi1 cDNA clone. A single band in lane 6 (probe B) indicates that this spi1 gene fragment is represented in the zebrafish genome by one copy. (D) Survey of spi1 expression in early zebrafish development by RT-PCR. Templates in control lanes (a–d) are: a, plasmid DNA; b, genomic DNA; c, water; d, RT-PCR without reverse transcriptase. Developmental ages from which RNA were prepared are 2, 8, 16, and 24 hpf and 2, 3, 5, and 7 dpf. |
|
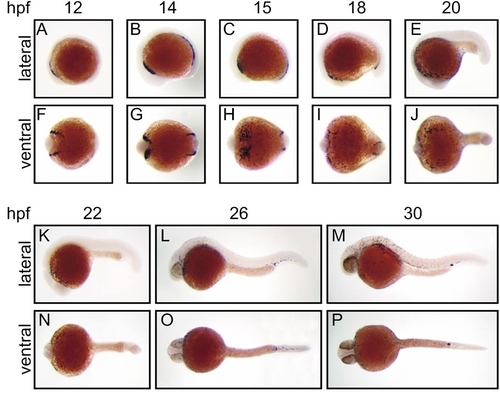
Expression of zebrafish spi1 in early embryonic development. Whole-mount in situ hybridization analysis of spi1 expression in early zebrafish development. Panels show direct lateral (A–E, K–M) and ventral (F–J, N–P) views of embryos at each of the developmental times (hpf) indicated, with anterior to the left. In each case, the paired lateral and ventral views are of the same embryo. The results illustrated were generated with a 1034-nt riboprobe spanning the entire spi1 cDNA; identical patterns were obtained with a 367-nt riboprobe corresponding to sequences encoding the more unique transactivation domain. |
|
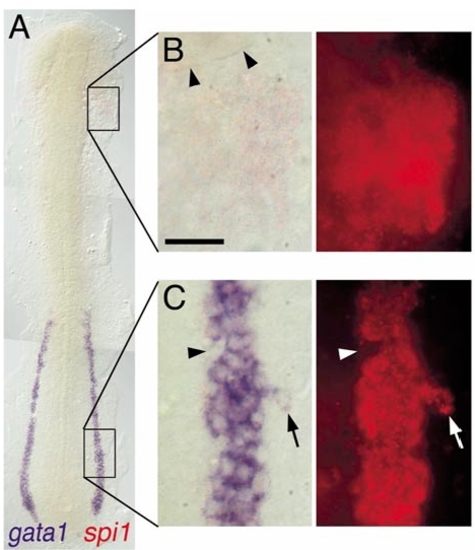
Expression of spi1 relative to gata1 in the lateral plate mesoderm. Two-color in situ hybridization gene expression analysis of wild-type zebrafish embryo (12 somite, flat mount, rostral up). (A)Alow-power view spanning the entire lateral plate mesoderm (LPM). (B, C) High-magnification views (63x water immersion lens) of regions boxed in (A), in which the expression of spi1 has been detected by fluorescence of Fast Red using a RITC filter set. (B) spi1+gata1- cells in the rostral LPM. Arrowheads indicate the caudal margin of the eye. (C) spi1+gata1+ cells in the caudal LPM. Arrowhead indicates an indentation to the otherwise uniform LPMgata1+ domain, due to several cells that express neither gata1 nor spi1. Arrow indicates a lateral irregularity in the LPM gata1 domain, due to several cells that express both gata1 and spi1. Scale bar in (B), 30 μm. |
|
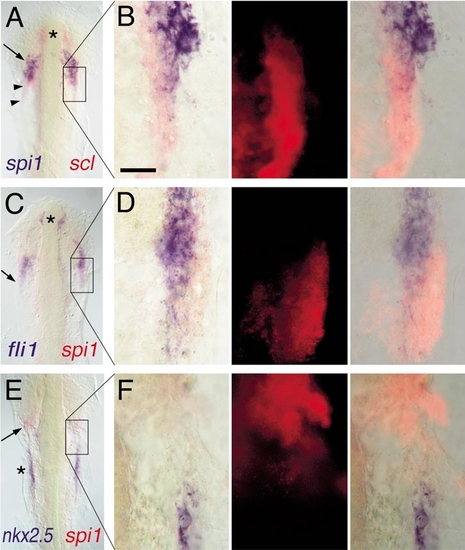
Expression of spi1 relative to other markers of lateral plate mesoderm fates. Two-color in situ hybridization gene expression analysis of wild-type zebrafish embryos (12 somite, flat mount, anterior up). Each panel in the left column shows a low-power view of the head and rostral lateral plate (A, C, E), and the corresponding three panels to the right show high-magnification views (63x water immersion lens) of particular regions of interest in which the expression of scl or spi1 has been detected by fluorescence of Fast Red using an RITC filter set (B, D, F). In places, the presence of high levels of blue NBT/BCIP precipitate quenches the fluorescent signal. (A, B) spi1 (blue) and scl (red). Asterisk marks rostral portion of scl+/spi1- cells, arrow shows domain of scl+/spi1+ cells, and arrowheads show scl+/spi1- cells caudal to the domain of coexpressing cells. (C, D) fli1 (blue) and spi1 (red). Asterisk marks rostral fli1+/spi1- cells, and the arrow shows that, although fli1 and spi1 are largely coexpressed, at the lateral margin, some fli1-/spi1+ cells are evident. (E, F) nkx2.5 (blue) and spi1 (red). The heart anlage marked by nkx2.5 (asterisk) is separate and caudal to the region of spi1 expression (arrow). Scale bar in (B), 30 μm. |
|
Fate mapping of rostral lateral plate mesoderm cells. (Animals are positioned with rostral to the left and dorsal up.) (A) White light image of illustrating the cells targeted for uncaging at 12 somites (arrowheads). e, eye; m, midbrain. Scale bar, 50 μm. (B) Video capture of a freshly labeled embryo at 13 somites, with uncaged cells shown in green by overlay from a fluorescent image. Arrowheads mark the caudal rim of the eye, asterisk marks the rostral end of the central nervous system. Scale bar, 100 μm. (C) The same embryo after the onset of circulation. The arrow marks the caudal rim of the eye, the asterisk the site of uncaging in the side of the head, and the arrowhead one of the large round fluorescent cells (left panel, white light image; middle panel, fluorescent image; right panel, merged image). Scale bar, 100 μm. (D) At higher magnification, a large round cell (arrow) is shown in the Ducts of Cuvier. The asterisk and arrow indicate the main channel in which red blood cells flow, but they cannot be seen in this image because they are moving too fast (left panel, white light image; middle panel, fluorescent image; right panel, merged image). Scale bar, 50 μm. |
|
spi1 expression in the hematopoietic failure mutants cloche (clo) and spadetail (spt). (A, B) Whole-mount in situ hybridization demonstration of location of spi1 expression in wild-type (A) and clom39/clom39 (B) zebrafish (20 hpf), showing loss of expression in the clo mutant. At this age, clo homozygotes could not be recognized on the basis of coincident morphological features, but the expected proportion (29/109, 27%) of embryos from the mating of clo heterozygotes showed the appearance in (B). (C–F) Flat preparations of whole-mount in situ hybridization preparations of 14-somite wild-type (C, E) and sptb104/sptb104 (D, F) zebrafish embryos. Expression of gata1 in the caudal LPM is present in the wild-type (C) but not spt (D) embryo. (E, F) Rostral spi1 expression is retained in the spt embryo, despite loss of caudal LPM spi1-expressing cells. Panel (F) is representative of spi1 staining in 14 spt embryos in a clutch of 54 (26%) resulting from sptb104/+ interbreeding. (G, H) Myelopoiesis initiates in spt mutants despite erythropoietic failure. Methylene-blue-stained thick section of a 48-hpf spt embryo (G), indicating (arrow) the location of the granulocyte identified on electron microscopy by its characteristic cytoplasmic electron-dense elliptical granules (H). |
|
Caudal erythroid commitment (marked by gata1 expression) and rostral myeloid commitment (marked by spi1 expression) can proceed independently of each other. Whole-mount in situ hybridization preparations displaying regions of gata1 and spi1 expression in embryos either untreated (control) or injected with mRNA encoding the Xenopus BMP-4 or chordin proteins as indicated to the left. (A–D) Nontreated (A, C) and chordin mRNA-injected (B, D) embryos at 18–20 hpf showing that chordin-expressing embryos have reduced gata1 expression (arrow A, B) in the caudal intermediate cell mass (ICM) but retain rostral spi1 expression in the lateral plate mesoderm (LPM) (arrow, C, D). (E–H) Nontreated (E, G) and BMP-4 mRNA-injected (F, H) embryos at 12–14 hpf showing that BMP-4-expressing embryos have reduced extent of spi1 expression (arrow, G, H) but a markedly expanded domain of gata1 expression (arrow E, F). (I–L) Nontreated (I, K) and BMP-4 mRNA-injected (J, L) embryos at 24 hpf showing BMP-4-expressing embryos have reduced extent of spi1 expression (arrow, K) but a markedly expanded domain of gata1 expression in the posterior ICM (arrow, I, J). Images are illustrative of 169 Xenopus chordin-injected (53% severe, 47% moderate-mild) and 204 BMP-4-injected (44% severe, 56% moderate-mild) and control uninjected or diluent-injected embryos, collected for analysis from several independent injection days (BMP-4, n = 11; chordin, n = 6). |
|
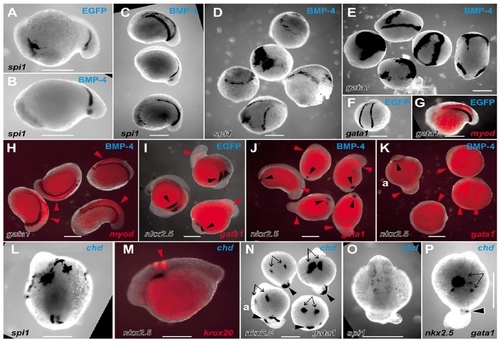
Actions of BMP and chordin on the LPM to perturb the balance of rostrocaudal LPM fates. Whole-mount in situ hybridization preparations of zebrafish embryos displaying expression domains of various markers (indicated in lower lefthand corner of each panel), in EGFP mRNA-injected (A, F, G, I), Xenopus BMP-4 mRNA-injected (B–E, H, J, K) and zebrafish chordin mRNA-injected (L–P) embryos (injected mRNA indicated in top righthand corner of each panel). Embryos are variously orientated to optimally display the range of expression patterns of interest. (A–N) Embryos are at approximately 14 hpf; (O, P) Approximately 24 hpf stages of development. (A–D) spi1 expression in control EGFP-injected (A), moderately (B and C), and severely (D) affected BMP-4-injected embryos. (A–C, approximately lateral views with head to the left; the five dysmorphic embryos in D are in various orientations.) (E, F) gata1 expression in five severely affected BMP-4-injected embryos (E, various orientations), showing ectopic expression and expansion of gata1 expression compared with the wild-type expression pattern observed in EGFP-injected embryos (F). (G, H) Group of four moderately BMP-4-affected embryos (H) displaying normal expression of gata1 and myod (red arrowheads) (various orientations), compared with the wild-type expression pattern observed in EGFP-injected embryos (G). (I, J) Group of five moderately BMP-4-affected embryos (J) showing normal gata1 expression (red arrowheads) but markedly diminished nkx2.5 expression (black arrowheads) (various orientations), compared with the wild-type expression pattern observed in EGFP-injected embryos (I). (K) Three severely affected BMP-4-injected embryos showing expanded gata1 expression and loss of nkx2.5 expression, including a relatively unaffected embryo (upper left, marked “a”) for comparison with rostral nkx2.5 strips (black arrowhead) and caudal gata1 stripes (red arrowheads). (L) Dorsal view (head at top) of a chordin-injected embryo showing extensive rostral spi1 and diminished caudal spi1 expression domains. (M) Lateral view (head to left) showing relationship of nkx2.5 and krox20 in moderately chordin-affected embryo. (N) Dorsal views (head to top) of three moderately chordin-affected embryos showing markedly reduced extent of caudal gata1 expression (black arrowheads) and less affected more rostral nkx2.5 expression (black arrows), with a minimally affected embryo (lower left, marked “a”) for comparison. The wild-type expression pattern of these genes in EGFP-injected embryos is shown in two colors (G, I). (O, P) Dorsal views (head to top) of moderately affected chordin-injected embryos showing preserved dispersed spi1 expression (O), bilateral nkx2.5 expression (P, arrows), and small spot of gata1 expression in tail stub (P, arrowhead). Images are representative of the spectrum of effects observed in 137 BMP-4- and 78 zebrafish chordin-injected embryos scored at ≈14 hpf (19/137 and 41/78 severely affected, respectively), and 154 BMP-4- and 66 chordin-injected embryos scored at ≈24 hpf (21/154 and 13/66 severely affected, respectively), collected from several independent injection days (BMP-4, n = 3; chordin, n = 2) and divided between the various groups of in situ hybridization analyses. In these experiments, control embryos were injected with 10 pg of mRNA encoding EGFP with a <5% abnormality rate (94 embryos, which were divided into groups to demonstrate the wild-type pattern for the various in situ hybridization expression analyses). Scale bars, 0.3 mm. |
|
Expression of spi1, fli1, and scl in wild-type and chordino (din) zebrafish embryos. (A, B) Flat-mount 12-somite wild-type (A) and chordino (B) embryos stained with spi1 riboprobe. Embryos were opened in the middle of their backs, deyolked, and flat mounted to display ventral views of the discontinuous rostral (top) and caudal (bottom) ends of the embryo. In chordino, the number of rostral spi1+ cells is not reduced, and they are more dispersed. (C–F) Wild-type (C, E) and chordino (D, F) embryos stained with scl (blue in C, D) or fli1 (blue in E, F) and spi1 (red in C–F) riboprobes. Although the rostral LPM is somewhat reduced in size in chordino, it still makes cell types expressing these three markers, while the caudal LPM is greatly enlarged. The extent of caudal of spi1-expression was not reduced in chordino mutants, although it was altered in shape; this domain of expression is more completely shown in (D) and (F), rather than in (B). Scale bars, 100 μm. |
|
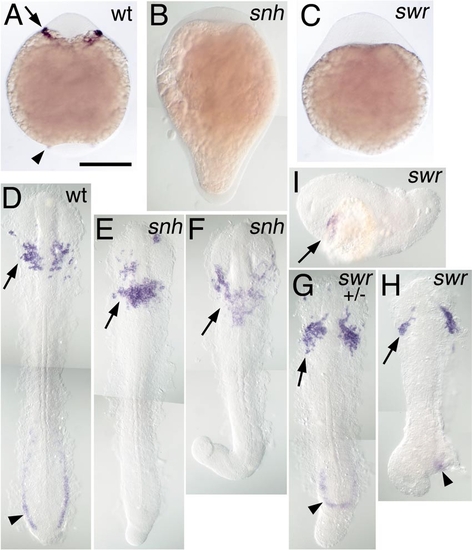
Rostral expression of spi1 in BMP pathway mutants. Expression of spi1 is shown in the 8-somite stage (A–C) and 15-somite stage (D–I) embryos, in wt (A, D), snailhouse/bmp7 (snh; B, E, F), and swirl/bmp2b (swr; B, G–I) loss-of-function genetic backgrounds. Both snh and swr phenotypes are variably expressive: (E, F) Increasingly severe snh homozygous recessive phenotypes; (G) a severe swr dominant heterozygotic phenotype; (H, I) Increasingly severe swr homozygote phenotypes. (A–C) Embryos in whole mount from a ventral view, anterior to the top. (D–H) Embryos dissected from yolk and flat mounted with anterior to the top; (I) A swr embryo in lateral view, anterior to the left. Rostral expression of spi1 is marked with an arrow (A, D–I), and caudal expression is marked with an arrowhead (A, D, G, H), showing that despite the loss of the caudal domain, rostral spi1 expression is maintained in embryos exhibiting extreme “dorsalization.” |
Reprinted from Developmental Biology, 246(2), Lieschke, G.J., Oates, A.C., Paw, B.H., Thompson, M.A., Hall, N.E., Ward, A.C., Ho, R.K., Zon, L.I., and Layton, J.E., Zebrafish SPI-1 (PU.1) marks a site of myeloid development independent of primitive erythropoiesis: implications for axial patterning, 274-295, Copyright (2002) with permission from Elsevier. Full text @ Dev. Biol.


