- Title
-
Zebrafish Mesp family genes, mesp-a and mesp-b are segmentally expressed in the presomitic mesoderm, and Mesp-b confers the anterior identity to the developing somites
- Authors
- Sawada, A., Fritz, A., Jiang, Y., Yamamoto, A., Yamasu, K., Kuroiwa, A., Saga, Y., and Takeda, H.
- Source
- Full text @ Development
|
Normal expression patterns of mesp-a and mesp-b transcripts in zebrafish embryos. Embryos are oriented with anterior (animal pole) to the top (except for B, in which the embryo is viewed from the animal pole). (A,B) mesp-a expression at the shield stage. mesp-a is expressed in the blastoderm margin with a small gap (arrowhead, A). (B) Animal-pole view of an embryo double-stained with goosecoid (gsc). gsc expression is seen within the gap in mesp-a expression (arrowhead). (C-F) Dorsal views of embryos hybridized with a mesp-a probe at 80% epiboly (C), 100% epiboly (D) and 10- to 12-somite stages (E,F). As gastrulation proceeds the marginal expression expands along the animal-vegetal axis in the dorsal region (anterior edge indicated by arrowhead in C). However, the expression is rapidly down-regulated in most of the area except in the anterior border, leaving a pair of stripes (D). During the segmentation period, one or two stripes of expression are visible (arrowheads in E,F). (G-I) mesp-b expression at the shield stage (G) and 10- to 12-somite stages (H,I). No mesp-b expression is detected during gastrulation. During the segmentation period, two or three stripes of expression are visible (arrowheads in H,I). (J,K) Two-colour staining with DIG-labeled mesp-a and fluorescein-labeled mesp-b probes at the 10- somite stage. The embryo was first processed for mesp-b staining, then photographed (red in J), followed by mesp-a staining (blue in K). The expression domains of mesp-a and mesp-b overlap (arrowheads, K). Bars, 100 μm. EXPRESSION / LABELING:
|
|
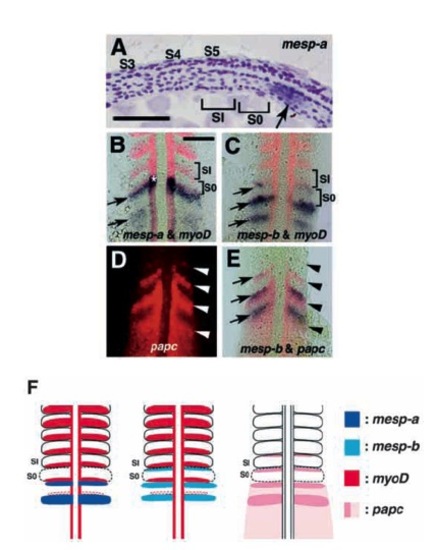
Expression patterns of mesp-a and mesp-b in the presomitic mesoderm. Embryos are oriented with anterior to the top (except for A, in which anterior is to the left). (A) Longitudinal section through a 5-somite stage embryo hybridized with a mesp-a probe. Somites 3, 4 and 5 are labeled as S3, S4 and S5. A newly formed and forming (or the most anterior presumptive) somites are designated as SI and S0, respectively. The mesp-a-positive region (arrow) is located posterior to S0. (B,C) Two-colour staining with myoD (red) and mesp-a (blue in B) or mesp-b (blue in C) at the 10-somite stage. Dorsal views of flat-mounted embryos are shown. Arrows indicate the stripes of mesp genes. (D,E) Two-colour staining with paraxial protocadherin (papc, red) and mesp-b (blue) at the 10-somite stage. Dorsal views under fluorescence (D) and bright-field optics (E) are shown. Arrowheads indicate the anterior borders of papc expression domains and arrows indicate mesp-b expression stripes. Note that both expression domains overlap, sharing the same anterior border. (F) Simplified diagrams illustrating expression patterns of mesp-a, mesp-b, myoD and papc. Bars, 50 μm. EXPRESSION / LABELING:
|
|
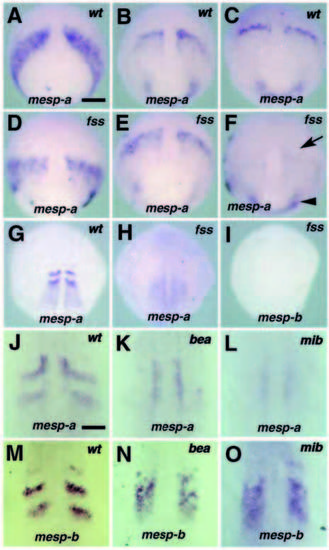
mesp expression in fss-type mutants. In all panels, the genotype of embryo is shown in the upper right corner and the probe used is at the bottom. (A-I) mesp expression in wild-type and fss embryos at 70% epiboly (A,D), 90% epiboly (B,E), 95% epiboly (C,F) and 12-somite stages (G-I). The normal expression pattern of mesp-a is seen in both wild-type and fss embryos up to 90% epiboly. In fss embryos, however, the striped expression is not maintained in later stages (arrow in F) while the expression at the blastoderm margin persists (arrowhead in F). Neither mesp-a nor mesp-b is expressed in fss mutants during segmentation (G-I). mesp expression in wild-type (J,M), bea (K,N) and mib (L,O) embryos at the 10- somite stage. mesp-b expression loses its striped pattern and shows a ‘salt and pepper’ pattern, which covers a region two- to three-somites wide in the paraxial mesoderm (N,O). As compared with mesp-b, mesp-a expression in the mutants is very weak and diffuse, and sometimes undetectable except for that in the adaxial cells (K,L). Bar in A, 100 μm; in J, 30 μm. EXPRESSION / LABELING:
|
|
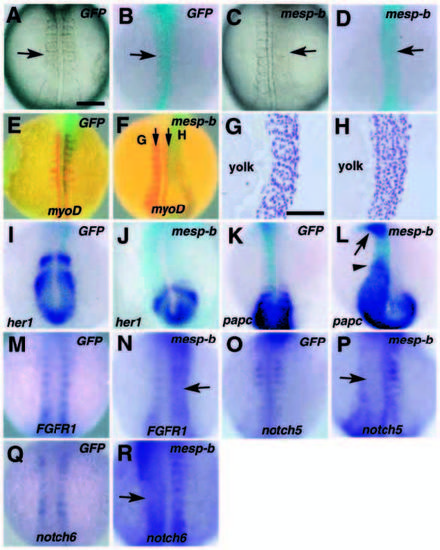
Effect of Mesp-b misexpression on somite formation. Whole-mount samples are viewed dorsally. In all pictures, embryos at the 8- to 12-somite stages are shown and oriented with anterior to the top. The injected RNA is noted in the upper right corner and the probe used is at the bottom. Light blue staining in B,D-F and I-L marks the localization of coinjected β-galactosidase. The samples in M-R were not stained for β-galactosidase activity, which sometimes affects weak in situ staining. The injected embryos showing severe segmentation defects were selected and processed for notch or FGFR1 staining. (A-D) Live embryos injected with GFP (A) or mesp-b (C) and β-galactosidase staining of the same embryos (B,D). Somites fail to form in the mesp-b-injected region (arrow in C,D). (E-H) GFP RNA injection does not affect myoD expression (red staining, E), while segmental myoD expression is either lost or disrupted by the overexpression of mesp-b (F). (G,H) Longitudinal sections of the sample at the levels indicated by the arrows in F. Segmentation is disturbed only in the injected region (H). (I,J) her1 expression in GFP-injected (I) and mesp-b-injected (J) embryos. In the mesp-b-injected embryo (J), light blue staining for b-galactosidase activity is seen on both sides of the embryos. Although her1 expression domains become irregularly shaped, mesp-b injection does not affect the segmental expression of her1. (K,L) papc (blue) expression in GFP-injected (K) and mesp-b-injected (L) embryos. papc loses its segmental expression in the anterior presomitic mesoderm following mesp-b injection. In some cases, papc expression is not down-regulated correctly, resulting in the anteriorly expanded expression (arrowhead in L). Furthermore, expression of papc is sometimes elevated in the head mesenchyme (arrow in L). (M,N) FGFR1 expression in GFP-injected (M) and mesp-b-injected (N) embryos. The expression, which is normally restricted to the presomitic mesoderm and the anterior of formed somites, loses its segmental pattern in the mesp-b-injected region (arrow in N). (O,P) notch5 expression in GFP-injected (N) and mesp-b-injected (O) embryos. The expression, which is normally restricted to the posterior of formed somites (O), is down-regulated in the mesp-b-injected region (arrow in P). (Q, R) notch6 expression in GFP-injected (Q) and mesp-b-injected (R) embryos. The expression, which is normally restricted to the anterior of formed somites, loses its segmental pattern in the mesp-b-injected region (arrow in R). Bars in A and G, 100 and 50 μm respectively. |
|
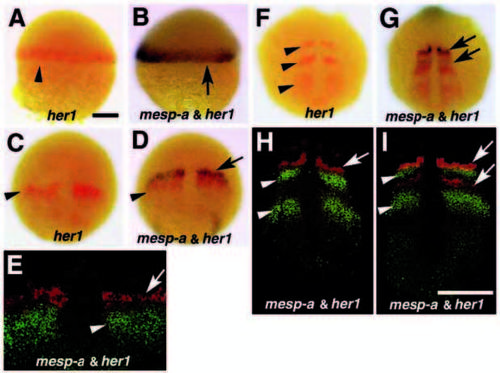
Relationship between mesp-a and her1 expression domains from gastrula to early segmentation period. In all pictures, the probe used is shown at the bottom. Two colour staining with mesp-a and her1 at shield (A,B), 90% epiboly (C-E) and 5-somite (F-I) stages. Lateral views with dorsal to the right (A,B) and dorsal views with anterior to the top (C-I) are shown. Arrowheads indicate her1 expression domains and arrows indicate mesp-a. Hybridized embryos were first processed for her1 (red) staining, photographed, and then processed for mesp-a (blue) staining (A-D,F,G). In E,H and I, hybridized signals were visualized with Fast Red and ELF-97 (see Material and Methods), and the flat-mounted samples were viewed under fluorescent microscopy (mesp-a in red and her1 in green). At the shield stage, the expression domain of mesp-a overlaps with that of her1 (A,B). As gastrulation proceeds, they become completely segregated such that the mesp-a stripes are located more anteriorly (arrow and arrowhead in D and E). During the segmentation period, the anteriormost decaying stripes of the two genes are partially overlapped, while the stripes are seen juxtaposed at the stage when the only one pair of mesp-a strip is observed (F-I). Bars, 100 μm. EXPRESSION / LABELING:
|
|
Temporal and spatial cycle of her1 expression in the presomitic mesoderm between 5- and 7-somite stages. For staging criteria, see text. The embryos which had been hybridized with her1 and mesp-a probes were first processed for her1 staining (Fast Red), followed by mesp-a staining (BM purple). A pair of photographs in upper (A-G; rhodamine filter) and lower (A′-G′; bright field) panels were taken of the same flat mounted samples. Under the rhodamine filter, only the her1 signal is sensitively detected. Simplified diagrams illustrating expression profile of her1 (red) and mesp-a (blue) are shown at the bottom (A′′- G′′). Solid lines represent formed somites while dotted lines represent successively forming somites. The her1 expression domain appears around the tailbud, and moves anteriorly until it finally overlaps with the most anterior stripe of mesp-a. Both stripes disappear near the point of furrow formation. The posterior tip of the tailbud is always positive for her1 transcripts. A stripe of her1 appears every 30 minutes in the tailbud region, and persists for about 1.5 hours (three somite cycles in zebrafish). Since we cannot judge accurately the lengths of individual sub-stages, we make no claim that the diagrams at the bottom are evenly spaced in time. Bars, 100 μm. EXPRESSION / LABELING:
|


