
Image
|
Figure Caption
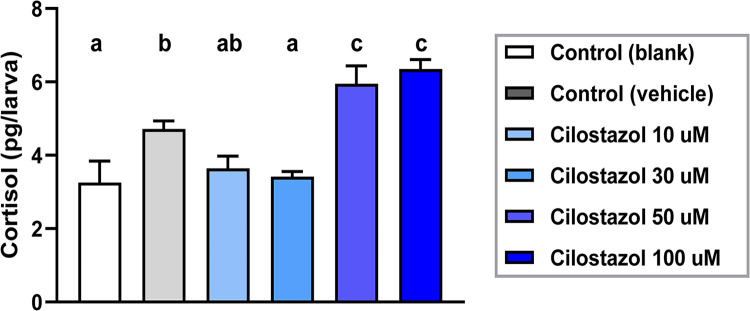
Fig 3 Whole-body cortisol levels after exposure to varying doses of cilostazol as well as controls from 10 hpf to 5 dpf, and measured by ELISA of larval extracts.
Each bar represents the average of 3 independent treated groups, with each group containing 30 larvae and subject to duplicate ELISA tests. Histograms with different letters above them are significantly different (ANOVA and Duncan’s multiple test, P < 0.05).
Acknowledgments
This image is the copyrighted work of the attributed author or publisher, and
ZFIN has permission only to display this image to its users.
Additional permissions should be obtained from the applicable author or publisher of the image.
Full text @ PLoS One