
FIGURE
Fig. 4
- ID
- ZDB-FIG-260114-4
- Publication
- Kumar et al., 2025 - Neurotoxicological Effects of 4-Bromodiphenyl Ether in Adult Zebrafish: DNA Damage, Oxidative Stress, Histology and Biomolecular Alterations
- Other Figures
- All Figure Page
- Back to All Figure Page
Fig. 4
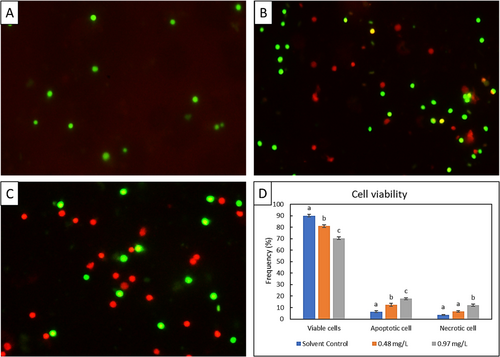
Photomicrographs showing the acridine orange and ethidium bromide (AO/EB) double staining of zebrafish brain cells. (A) Solvent control, (B) 0.48 mg/L BDE-3 exposed group, (C) 0.97 mg/L BDE-3 exposed group. apoptotic cell (yellow-coloured cells), necrotic cell (red coloured cells), viable cell (green coloured cells). (D) Showing the various type of cell frequency (%) in zebrafish larvae. Data are expressed as mean ± SE (n = 3). The different letters a, b and c show significant difference between the different treatment groups (one Way ANOVA + Tukey's post hoc test, p ≤ 0.05). |
Expression Data
Expression Detail
Antibody Labeling
Phenotype Data
Phenotype Detail
Acknowledgments
This image is the copyrighted work of the attributed author or publisher, and
ZFIN has permission only to display this image to its users.
Additional permissions should be obtained from the applicable author or publisher of the image.
Full text @ J. Biochem. Mol. Toxicol.