
|
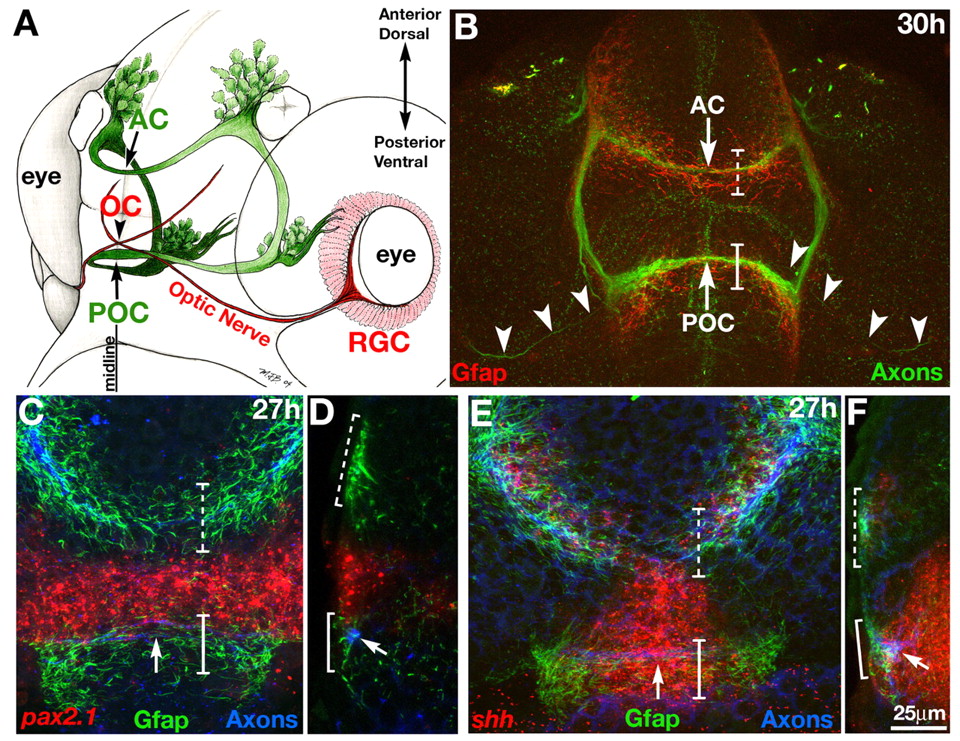
Fig. 1 Gfap-expressing cells in the commissure regions of the zebrafish forebrain. (A) Diagram of forebrain tracts and commissures. Commissural axons (green) cross the midline to form the anterior commissure (AC) and the postoptic commissure (POC). Retinal ganglion cells (RGCs) from the eye form the optic nerve and optic chiasm (OC). (B) Localization of RGC (arrowheads), AC and POC axons [immunolabeled with anti-acetylated tubulin (AT); green] in relation to Gfap+ cells (anti-Gfap; red) at 30 hpf. Gfap+ cells span the midline in the region of the AC (dashed bracket) and POC (solid brackets). (C,D) pax2a in situ labeling (red) of the optic stalk region in relation to axons (blue, arrows) and Gfap+ cells (green, brackets) at 27 hpf. (E,F) shh in situ labeling (red) in relation to axons (blue, arrows) and Gfap+ cells (green, brackets). (B,C,E) Frontal views of the forebrain, anterior/dorsal up; (D,F) lateral views, anterior left, anterior/dorsal up. Because brain flexure brings dorsal structures into an anterior position, `anterior′ and `posterior′ will be used in subsequent figures, to reflect the eventual positions of these two commissures.