
- Title
-
Initial anteroposterior pattern of the zebrafish central nervous system is determined by differential competence of the epiblast
- Authors
- Koshida, S., Shinya, M., Mizuno, T., Kuroiwa, A., and Takeda, H.
- Source
- Full text @ Development
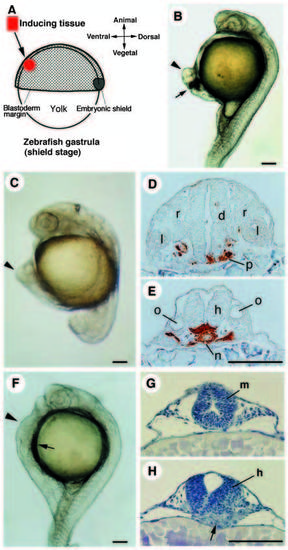
Secondary axes induced by transplantation of organizer tissues. Arrowheads in B, C and F indicate the secondary axis. (A) Schematic representation of organizer transplantation. A small piece of avian Hensen’s node (HN), fish organizer (embryonic shield) or Noggin/Chordin COS7 cell aggregate is transplanted into the host ventral region, mostly about halfway between the blastoderm margin and the animal pole, or near the margin in some cases. (B) Secondary axis induced by HN (stage 4) at 24 h. Arrow indicates the position of the transplanted HN. Chicken tissues appear dark because they contain yolk granules. (C-E) Secondary axis induced by the shield at 20 h. Cross sections at the level of the diencephalon (D) and the hindbrain (E) are shown. The donor cells are stained brown in the sections. Grafted shield differentiates into axial mesoderm and the ventral portion of the neural tube. (F-H) Secondary axis induced by Noggin/Chordin COS7 at 24 h. Cross sections at the level of the midbrain (G) and the hindbrain (H) are shown. Arrows indicate the position of the transplanted COS7 cells. COS7 cell mass is located under the induced neural tube (arrow in H). d, diencephalon; m, midbrain; h, hindbrain; l, lens; n, notochord; o, otic vesicle; p, prechordal plate; r, neural retina. Scale bars, 100 μm. |

Gene expression patterns around the grafts. Embryos are oriented with the animal pole to the top, except for E and I. Unless otherwise described, a black arrowhead, a red arrow and a dotted line indicate a grafted tissue, a dorsal midline of the host and the blastoderm margin, respectively. In all lateral views, dorsal is to the right. (A-E) Gastrula embryos grafted with the chicken Hensen’s node (HN, stage 4) at the shield stage (6 h) in the ventral region. (A) Lateral view of the embryo 4 hours after transplantation (late gastrula). Lateral (B) and ventral views (C) of the same host hybridized with otx2 probe. Ectopic expression of otx2 appears around the grafted HN with a sharp posterior boundary at the same latitude as that of host endogenous expression. (D) Ventral view of the host hybridized with otx2 probe, in which the graft is located more posteriorly (at the level of the hindbrain on the dorsal side) as compared with the sample shown in B and C. Ectopic expression is induced in the region just anterior to the graft but its posterior boundary remains unchanged with respect to the host endogenous expression. (E) Longitudinal section along the secondary axis induced by HN. The histological section shows neural induction as indicated by the thickened epithelium (e) around the grafted HN (arrowhead). The hypoblast (hp) and yolk syncytial nuclei (yn) are also seen in this section. (F,G) Lateral views of the host which received the HN at midblastula stage (4 h) and examined with otx2 expression at the early gastrula stage (70% epiboly, 7 h). The ectopic expression domain, which is fused with the endogenous one at the animal pole, shares the same posterior boundary as the host domain (F). By contrast, when HN of the same stage was grafted near the blastoderm margin and located in the host trunk region, no ectopic expression of otx2 is observed (G). (H-N) Host embryos that received biotin-labelled embryonic shields at early gastrula stage (6 h) in the ventral region. (H) Lateral view of the late gastrula (10 h) hybridized with otx2 probe. Ectopic expression is induced with a sharp posterior boundary at the same level as that of host endogenous expression domain. (I) Oblique animal-pole view of the hybridized sample (shown in H) in which donor cells were visualized by biotinperoxidase staining. Donor cells (brown, arrowhead) are widely distributed along the A-P axis but ectopic otx2 expression is observed only in the anterior region. (J,K) Longitudinal section and high magnification view of the host shown in I. Red arrowheads indicate the posterior boundaries of otx2 expression along both axes, showing that they are located at the same level (the secondary axis is to the left). The labelled donor cells are distributed along the A-P axis mainly in the underlying hypoblast. (L) Lateral view of the host stained with otx2, in which the donor cells (brown, arrowhead) are located in the trunk region by posterior transplantation. No induction of otx2 expression is detected. (M,N) Lateral views of the embryos hybridized with otx2 and krox-20 probes (5-somite stage, 12 h). Arrowheads indicate the anterior limit of transplanted donor cells (brown). Both otx2 and krox-20 are induced when the donor cells are located in the anterior region (M), while only krox-20 is induced when they are posteriorly located (N). (O-R) Gastrula embryos transplanted with Noggin/Chordin COS7 cells at the midblastula stage (sphere to dome stage). Lateral (O) and ventral views (P) of the host (10 h) hybridized with otx2 probe, and lateral (Q) and ventral views (R) of the host (6.5 h) hybridized with hoxa-1 probe are shown. Note that each ectopic expression domain shares the same boundary as the host domain. Scale bars, 100 μm. |

Gene expression and neural induction in ventralized embryos. Embryos are oriented with the animal pole to the top, except for G. (A) Schematic representation of the experiment. Noggin/Chordin COS7 cells were transplanted into ventralized blastula (4 h) from which the vegetal yolk mass had been removed. (B,C) gsc expression in normal (B) and ventralized (C) embryos at the shield stage. No gsc expression is detected in a ventralized embryo. (D) Dorsal view of normal gastrula (90%-epiboly) stained with otx2 probe and anti-Ntl antibody. The region fated to become forebrain and midbrain is positive for otx2 transcripts (dark blue), while the blastoderm margin (arrow) and the notochord (n) are positive for Ntl (light brown). (E) Lateral view of a ventralized gastrula (90%-epiboly) stained with otx2 probe and anti-Ntl antibody. The blastoderm margin is positive for Ntl (arrow), while neither Ntl staining in the notochord nor otx2 expression in the head region is detected. (F) The ventralized gastrula (90%-epiboly) stained with otx2 probe and anti-Ntl antibody. The ventralized embryo was grafted with Noggin/Chordin COS7 cells at the blastula stage. otx2 expression is induced in the anterior region around the graft (arrowheads) with a sharp posterior boundary. (G) Longitudinal section of the host shown in G along the transplanted Noggin/Chordin COS7 cells (dotted line). The posterior boundary of induced otx2 expression domain is indicated by an arrowhead. The animal pole (an) is to the left and the vegetal pole (vg) to the right. Scale bars, 100 μm. |

Roles of the yolk cell, the marginal mesoderm and FGF-R signalling in A-P patterning of the epiblast. Embryos are oriented with the animal pole to the top. (A-C) Transplantation of the yolk cell (YC) in the animal pole region. (A) Schematic representation of the experiment. The recombinants were fixed when the sibling reached 80%-epiboly and examined for otx2 (B) or hoxa-1 (C) expression by in situ hybridization. In the recombinant, otx2 expression domain is reduced into a small patch (arrowhead) in between both YC, while the donor YC induces hoxa-1 expression (red arrows) in the animal pole region of the host. Dotted lines in B indicate the blastoderm margin on both sides. (D-G) Injection of mRNAs encoding dominant-negative FGF receptor (XFD) (E,G) or control (HAVnot) mRNAs (D,F). The gastrula embryos injected at the 1-cell stage were hybridized with otx2 (D,E) or hoxa-1 (F,G) probe, followed by anti-Ntl staining (light brown). Dorsal views are shown. The otx2 expression domain shifts toward the blastoderm margin in XFD-injected embryos. Probably due to an uneven distribution of injected RNAs, the effects of RNA injection were sometimes limited. The posterior shift in the expression boundary is always correlated with the loss of the mesoderm in the blastoderm margin (a loss of the Ntl staining is indicated by a pair of red arrowheads in E). The XFD injection greatly reduces hoxa-1 expression (G). Control RNA injection does not affect these gene expressions in the embryos (D,F). (H-J) Transplantation of the shield into XFD-injected early gastrula (6 h). (H) Schematic representation of the experiment. (I) Lateral view of the host embryo (late gastrula, 10 h) stained with otx2 probe and anti-Ntl antibody. Ectopic (to the left, arrowhead) as well as endogenous (to the right) expression have no clear posterior boundary but extend near the margin. (J) Cross section of the ventral part of the host shown in I. Ectopic expression is induced around the donor-derived notochord (positive for Ntl staining, red arrowhead). (K-M) Transplantation of the ventral-marginal cells into the animal-pole region of the host blastula. (K) Schematic representation of the experiment. The transplanted embryos (late gastrula, 10 h) were stained with otx2 (L, oblique animal-pole view) or hoxa-1 probe (M, animal-pole view) and then the donor cells stained. otx2 expression is suppressed while hoxa-1 expression is induced (arrowheads) around the transplanted donor cells (brown). Scale bars, 100 μm. |
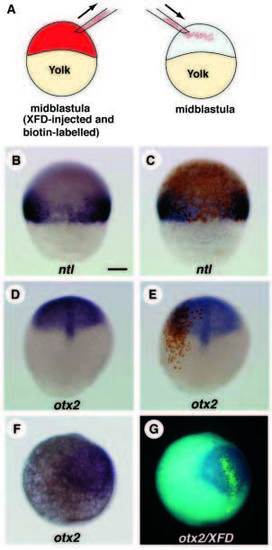
Role of FGF-R signalling in defining the posterior boundary of the otx2-expression domain. Embryos are oriented with the animal pole to the top. (A) Schematic representation of the experiment. The normal host blastula was transplanted with XFD-injected blastomeres. (B,C) The transplanted early gastrula (shield) stained with ntl probe (B), followed by biotin-peroxidase. The donor cells do not express ntl transcripts even in the marginal region. Note that the host marginal cells surrounded by XFD-donor cells tended to be less positive for ntl transcripts. This is probably due to the community effect (Gurdon et al., 1993) or the absorption of ligands by XFDoverexpressed donor cells. (D,E) The transplanted embryos (late gastrula, 10 h) were first stained with otx2 probe, followed by staining donor cells. Dorsal views of the same host before (D) and after (E) staining of the donor cells are shown. XFD-injected blastomeres (brown in E) strictly follow the host otx2-expression boundary. (F,G) The host embryo (late gastrula, 10 h) hybridized with DIG-labelled otx2 probe and fluorescein-labelled XFD probe is seen under transmitted light (F) or under ultraviolet light (G). The blastomeres containing XFD mRNAs (light green in G) follow the host otx2-expression boundary. Scale bar, 100 μm. |