
- Title
-
Spatial regulation of a zebrafish patched homologue reflects the roles of sonic hedgehog and protein kinase A in neural tube and somite patterning
- Authors
- Concordet, J.P., Lewis, K.E., Moore, J.W., Goodrich, L.V., Johnson, R.L., Scott, M.P., and Ingham, P.W.
- Source
- Full text @ Development
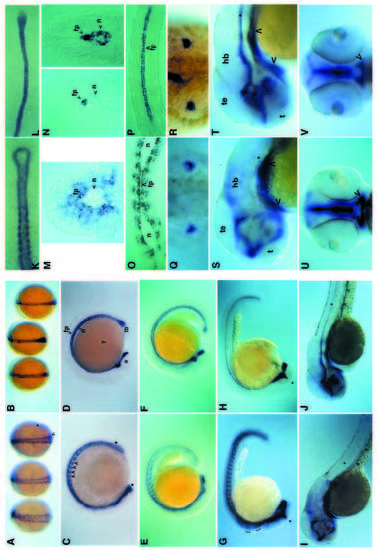
Comparison of the ptc1 and shh expression patterns during wild-type embryogenesis. Transcripts were revealed by in situ hybridization with antisense RNA probes to ptc1 (A,C,E,G,I,K,M,O,Q,S,U) or shh (B,D,F,H,J,L,N,P,R,T,V). (A,B) Dorsal views of embryos at the end of gastrulation. The arrowhead indicates a row of hypoblast cells adjacent to the axial mesoderm which express ptc1 at high levels. The asterisk indicates the anterior boundary of the ptc1 low-level expression domain in the presomitic mesoderm. (C,D) Lateral views of 10-somite (C) and 14- somite (D) stage embryos. Arrowheads denote ptc1 expression in somites. Asterisks delimit the expression of ptc1 in the neurectoderm all along the anteroposterior axis of the embryo. (E,F) 18-somite stage embryos. (G,H) 26-somite stage. Asterisks indicate the dorsal extension of ptc1 and shh expression domains in the diencephalon. Brackets indicate upregulation of ptc1 in rhombomeres 2, 4 and 6, a modulation of expression that is unrelated to shh expression (see also Fig. 5c). (I,J) Embryos at 48 hours of development. Asterisks indicate the position of the floor plate of the neural tube. Arrowheads indicate expression in the gut. golden mutant embryos, which are defective in pigmentation, were used to facilitate visualisation of ptc1 and shh expression. (K,L) 8-somite stage embryos. Dorsal view of flat preparations showing the complementarity between the paraxial expression of ptc1 and the axial expression of shh in the notochord and the tailbud. (M,N) Transverse sections through the trunk of embryos at 24 hours of development. (N) Sections at two different levels along the axis, the section on the right-hand side being more posterior. (O,P) Horizontal sections through the trunk of embryos at 24 hours of development. (Q,R) Dorsal view of the trunk of 36-hour-old embryos showing the expression of ptc1 and shh in the posterior region of the developing fins. (S,T) Detail of embryos shown in I and J, respectively. Asterisks indicate the position of the floor plate of the neural tube. Arrowheads indicate expression in the foregut. Expression in the hindbrain, when observed dorsally, was found to be restricted to periventricular cells in the midline (data not shown). (U,V) Frontal views of embryos shown in I and J, respectively. Arrowheads indicate expression in the foregut surrounding the developing mouth. Abbreviations : e, eye; fp, floor plate; hb, hindbrain; n, notochord; te, tectum; t, telencephalon; tb, tail bud; y, yolk. EXPRESSION / LABELING:
|
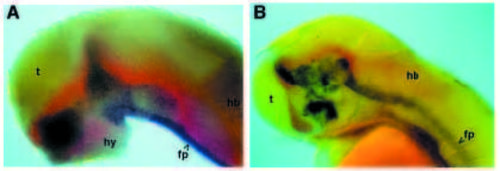
Simultaneous localisation of ptc1 and shh transcripts in the head. Whole embryos were hybridized simultaneously with riboprobes to ptc1 and shh revealing ptc1 expression in red staining and that of shh in blue. Lateral views are shown with anterior to the left; yolk and eyes were removed to improve brain visualisation. (A) Embryo at 36 hours of development. (B) Embryo at 48 hours of development. Abbreviations: fp, floor plate; hb, hindbrain; hy, hypothalamus; t, telencephalon. |
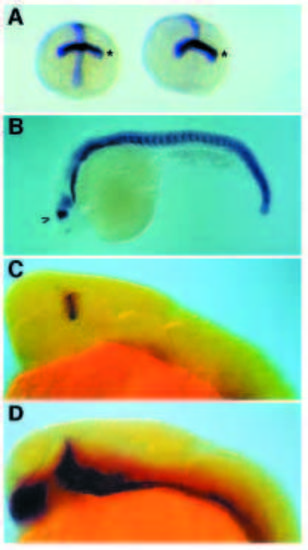
Expression of ptc1 and shh in cyclops mutants. ptc1 expression is detected in blue (A,B) or in red (C,D) and shh in blue (C,D). (A) Frontal view of embryos at the 1- to 2-somite stages. Expression of ptc1 is shown in a wild-type sib on the left and in a cyclops mutant on the right. To provide a landmark along the anteroposterior axis, embryos were simultaneously hybridized with a probe for pax-2 highlighting the position of the future posterior midbrain (asterisk). (B) ptc1 expression in a 24-hour-old cyclops mutant. The arrowhead indicates re-expression of ptc1 at high levels in a dorsoventral stripe in the diencephalon. (C) 24-hour-old cyclops embryos. ptc1 expression is revealed in red, shh in dark blue. (D) 24- hour-old wild-type embryo. EXPRESSION / LABELING:
|
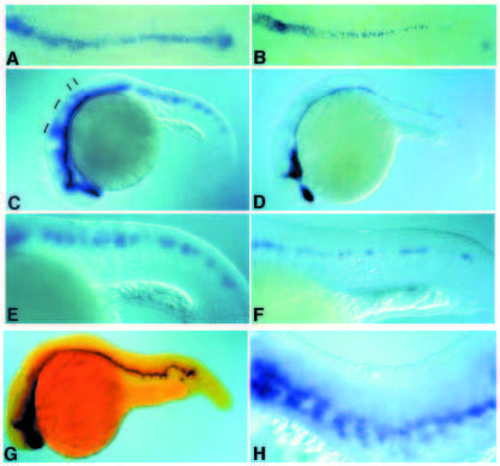
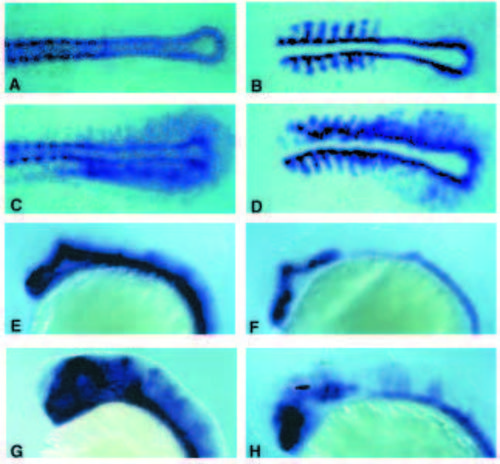
Comparison of ptc1 and shh expression in floating head and no tail mutant embryos. Expression of ptc1 (A,C,E) and shh (B,D,F) in flh mutant embryos. (A,B) Embryos at the 5-somite stage. (C,D) Embryos at 24 hours of development. Brackets and bars indicate modulation of ptc1 in different rhombomeres which is unrelated to shh expression. (E,F) Lateral view of the trunk of embryos shown in C,D. Expression of ptc1 and shh in ntl mutant embryos. (G) ntl mutant embryos at 24 hours of development. ptc1 expression is revealed in red, shh in blue. (H) Lateral view of the trunk of a 24-hour-old ntl embryo in which ptc1 expression is revealed in blue. EXPRESSION / LABELING:
|
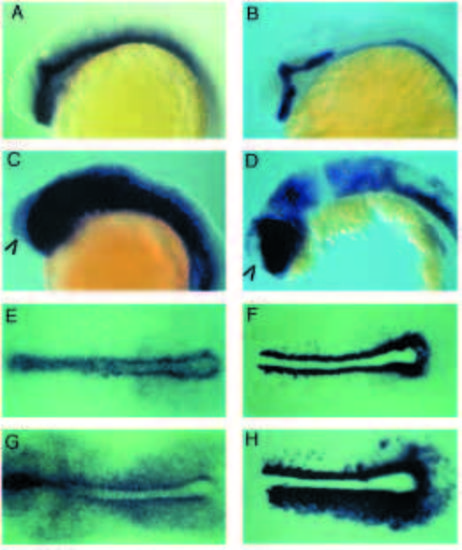
Induction of ptc1, myoD and nk2.2 expression by shh in the brain and early somitogenesis stage embryos. (A,C) Lateral views of ptc1 expression in the brain of 27-hour-old embryos. (A) Uninjected control embryo. (C) shh-injected embryo. (B,D) Lateral views of nk2.2 expression in the brain of 27-hour-old embryos. (B) Uninjected control embryo. (D) shh-injected embryo. Arrowheads in C, D show the telencephalon which is devoid of ectopic ptc1 and nk2.2 expression. (E,G) Dorsal views of ptc1 expression in flat preparations of embryos at early somitogenesis. (E) Uninjected embryo. (G) shh-injected embryos. No ectopic ptc1 expression was detected in the ectoderm. (F,H) Dorsal views of myoD expression in flat preparations of embryos at early somitogenesis. (F) Uninjected embryo. (H) shh-injected embryo. |
Induction of ptc1, nk2.2 and myoD expression in the brain, and in early somitogenesis stage embryos, by inhibition of PKA activity. (A,C) Dorsal views of ptc1 expression in flat preparations of embryos at early somitogenesis. (A) Uninjected embryo. (C) dominant negative PKA-injected embryos. (B,D) Dorsal views of myoD expression in flat preparations of embryos at early somitogenesis. (B) Uninjected embryo. (D) dominant negative PKAinjected embryos. (E,G) Lateral views of ptc1 expression in the brain of 27-hour-old embryos. (E) Uninjected control embryo. (G) dnPKA injected embryo. (F,H) Lateral views of nk2.2 expression in the brain of 27-hour-old embryos. (F) Uninjected control embryo. (H) dnPKA injected embryo. |
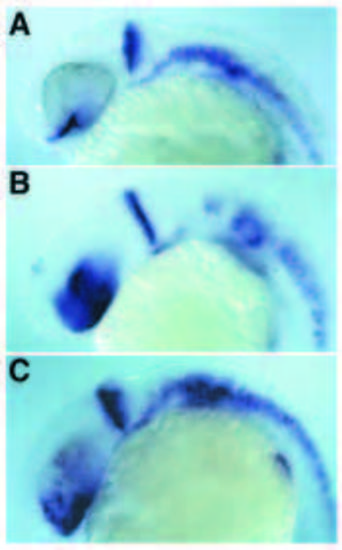
Expression of pax[b] in wild-type, shh-injected and dnPKA injected embryos. Expression of pax[b] in uninjected (A), shh injected (B) and dnPKA-injected (C) 27-hour-old embryos. Note expansion of expression into the eyes in the injected embryos in comparison to the restricted expression in the optic stalk (arrowhead) of the normal embryo. |
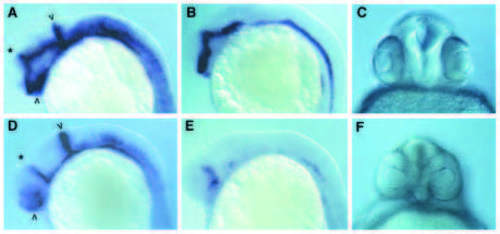
Suppression of midline signalling by cPKA activity. (A-C) normal (uninjected embryos) (D-F) embryos injected with cPKA RNA at the 2- to 4-cell stage. (A,D) were hybridised with probes for both pax[b] and ptc1. In D, most of the signal derives from the pax[b] probe including the stripe at the midbrain/hindbrain boundary (arrowhead) and the reduced staining in the optic stalks (arrowhead). The asterisk indicates the stripe of ptc1 expression in the diencephalon - note that in the injected embryo this extends further ventrally compared to the wild-type embryo, indicating a dorsalisation of the brain. (B,E) Hybridised with a probe for nk2.2. Note the marked loss of expression following injection of the cPKA mRNA. (C,F) Frontal views of the heads of 27- hour-old embryos, showing the partial fusion of the eyes in the cPKA-injected animal. |