
- Title
-
Specification of cell fates at the dorsal margin of the zebrafish gastrula
- Authors
- Melby, A.E., Warga, R.M., and Kimmel, C.B.
- Source
- Full text @ Development
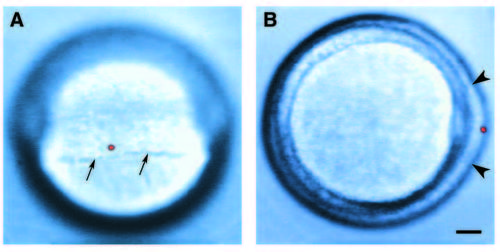
Dorsal (A) and animal pole (B) views of a shield stage embryo with a single labeled cell. Arrows in A indicate the margin of the blastoderm. Arrowheads in B mark the approximate edges of the embryonic shield. Scale bar, 100 μm. |
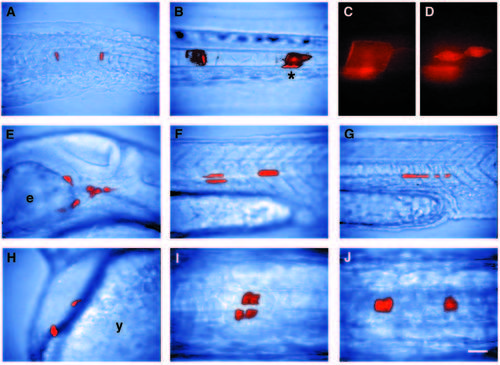
The fates of cells from the dorsal marginal region of the gastrula. (A,E-H) Side views during the early pharyngula period (24-36h); (BD) side views at 3d; (I,J) dorsal views during the pharyngula period. Anterior is to the left in all panels. A-D show the same embryo, in which coin-shaped cells of the notochord rudiment gave rise to both vacuolated notochord cells and notochord sheath by 2d. (A) The clone initially contained three cells at 1d: one cell anteriorly and two posteriorly. (B) At 3d, the anterior cell had become a vacuolated cell, and the posterior cells had generated one vacuolated cell and four notochord sheath cells. (C,D) Higher power fluorescent views of the posterior cells (asterisk in B) at different focal planes at 3d. (C) Vacuolated cell. (D) Sheath cells. Only two of the four notochord sheath cells are in focus. (E) Head mesenchyme: cells that were ventral and lateral to the brain, and were mesenchymal during the early pharyngula period. We sometimes observed these clones differentiating as endothelial cells (n=6) or parachordal cartilage (n=2). Head muscles also arise from cells that are mesenchymal at 1d (Schilling and Kimmel, 1994; Kimmel et al., 1990; Warga, 1996). (F) Somitic muscle: these cells spanned the length of the somite. Muscle clones were confined to one side of the animal if located in the trunk, but were often bilateral if located in the tail (Kimmel and Warga, 1987). (G) Hypochord: an axial tissue lying just below the notochord, and extending from the level of the first somite through the tail. Like the floor plate of the spinal cord, hypochord is composed of a single midline row of cells in zebrafish (Hatta and Kimmel, 1993). (H) Hatching gland: large granule-filled cells that lie on the surface of the pericardium. (I) Ventral nervous system: these clones included both morphologically identifiable neurons and other cells presumed to be glia or neuroblasts. This clone excluded floor plate. Neuroepithelial cells such as these and floor plate cells have a similar cuboidal morphology in side views, but floor plate can be distinguished in a dorsal view as forming a single midline row of cells. (J) Floor plate: part of a clone derived from a deep cell in the third layer of the epiblast. A,B,E-J are composites of bright-field and fluorescent images taken at the same focal plane; C and D are fluorescent images only. Scale bar, 40 μm in A,B,E-H; 100 μm in C,D,I,J. |
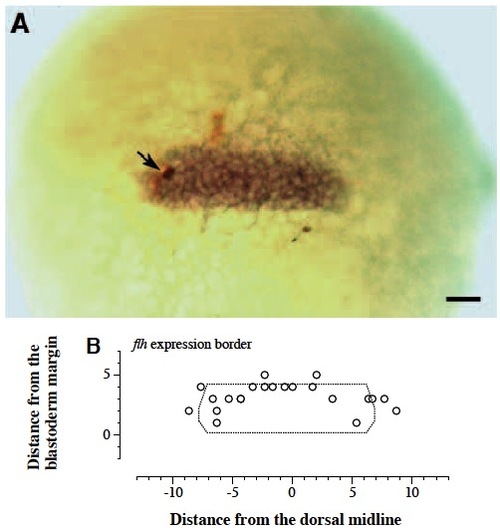
The flh RNA expression domain coincides with the notochord domain at the early gastrula stage. (A) Dorsal view of a double labeled gastrula. The cell marked with lineage tracer is stained brown (black arrow) and flh RNA is greenish-brown. Scale bar: 50 μm. (B) Map of the border of strongest flh expression. The axes of the graph are as in Fig. 3. Open circles represent the border of strongest flh expression determined relative to the coordinates of labeled cells. In some cases, both a lateral and a posterior boundary point were determined from a single labeled cell. The border of flh expression is defined as the outermost cell strongly expressing flh RNA. |
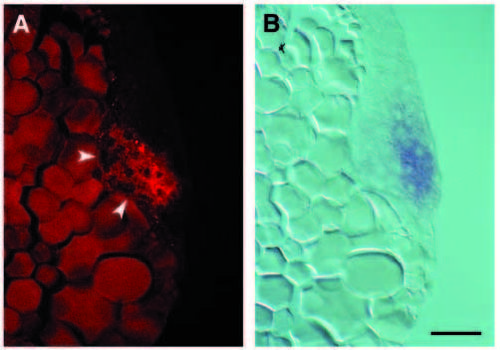
flh expression in the early gastrula does not substantially overlap with gsc expression. (A) Epifluorescent (Texas Red filter set) and (B) bright-field views of a midsagittal section through the embryonic shield of an early gastrula that was hybridized with probes for both gsc (red) and flh (blue) RNA. White arrowheads in A indicate red fluorescence due to gsc expression in involuted cells (the yolk is autofluorescent at this wavelength). B shows flh expression is restricted to the epiblast. Scale bar, 50 μm. EXPRESSION / LABELING:
|
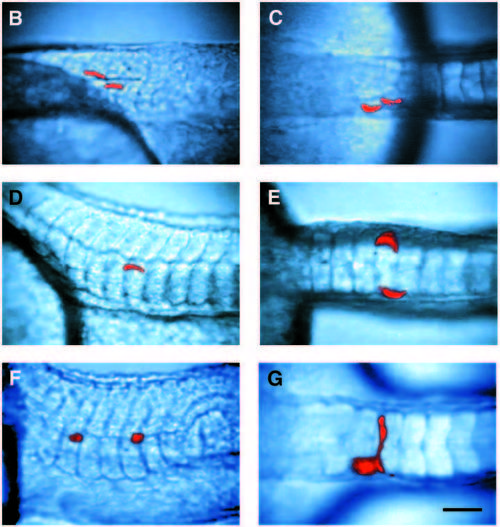
The fate of cells from the notochord domain in flh and ntl mutant embryos. (A) Map of the cells labeled in flh mutant embryos which gave rise to muscle. 10 of these cells fall within the boundary of the notochord domain. In wild-type embryos, 61 of 71 cells labeled within this boundary gave rise to notochord exclusively. The axes of the graph are as in Fig. 3. (B-E,G) flh and (F) ntl mutant embryos during the early pharyngula period, containing clones of cells derived from single labeled cells in the notochord domain of the gastrula. Side (B) and dorsal (C) views of a unilateral clone of muscle cells in a flh embryo. Side (D) and dorsal (E) views of a bilateral muscle clone in a flh embryo. (F) Side view of a clone of axial mesenchymal cells derived from a notochord domain cell in a ntl embryo. (G) Dorsal view of a clone containing a cell that spanned the midline in a flh embryo. Scale bar, 50 μm. PHENOTYPE:
|
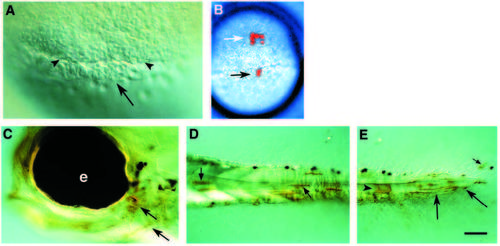
Dorsal marginal blastomeres can contribute to the forerunner cells. (A) Nomarski optics photograph showing the appearance of the forerunner cells at shield stage. Arrow points to the forerunner cell cluster, and arrowheads point to the margin of the blastoderm. B-E are from an embryo in which a labeled marginal blastomere contributed to both anterior mesendoderm and forerunner cell derivatives. (B) Dorsal view of the live embryo at late shield stage. The clone consists of a cluster of cells in the anterior hypoblast (white arrow) and two cells in the forerunner cell population (black arrow). (C-E) Whole-mount side views of the embryo at 3d, after it had been fixed and stained for the lineage label, biotin. Biotin staining appears brown, while pigment cells appear black. (C) The head region, showing labeled pharyngeal endoderm (arrows), derived from cell(s) in the anterior hypoblast. e, eye. (D) Part of the tail showing labeled muscle cells (arrows). (E) More posterior view of the tail showing labeled notochord (arrowhead), body wall mesenchyme (arrows), and fin mesenchyme (small arrow). Scale bar: 40 μm in A; 250 μm in B; 50 μm in C-E. |
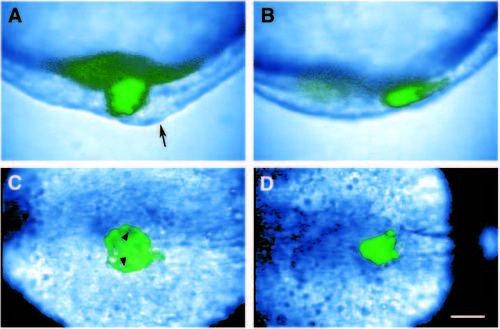
Caged fluorescein labeling of the forerunner population in wild-type and ntl mutant embryos. Composite video images of caged fluorescein labeling in wild-type (A,C) and ntl mutant (B, D) embryos. The forerunner cell population was labeled by uncaging during the early gastrula period (5.5-6.5h). Fluorescein-labeled cells are colored green. (A,B) Side views of the tailbud at the bud stage. Dorsal is to the right. In wild-type embryos, there is labeling in a cluster of cells located deep to the chordoneural hinge (arrow), the larger tissue mass on the dorsoanterior side of the tailbud. In ntl mutant embryos at the bud stage, the forerunner cell cluster appears to be adjacent to the chordoneural hinge, and the ventral side of the tailbud is proportionately larger. (C,D) Dorsal views of the tailbud at the 7-somite stage. The axial mesoderm extends anteriorly to the right. (C) By this stage, Kuppfer’s vesicle is obvious in the tailbud of wild-type embryos, arrowheads point to the inside wall of the vesicle. Cells lining Kupffer’s vesicle are specifically labeled. (D) In contrast, fluoresceinlabeled cells in ntl mutant embryos remain in a tight cluster. Scale bar, 50 μm in A,B; 72 μm in C,D. PHENOTYPE:
|
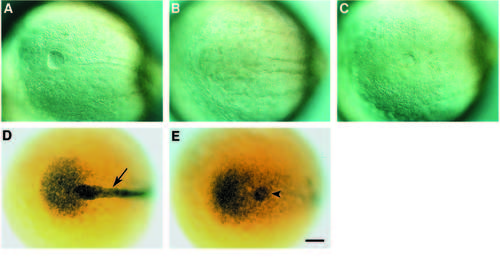
The ntl gene is required for the formation of Kupffer’s vesicle. (A-C) Kupffer’s vesicle never forms in ntl mutants, but can form in flh mutants. Nomarski optics photographs of dorsal views of the tailbuds of live wild-type (A), ntl (B), and flh (C) mutant embryos. Anterior extends to the right. (A) In wild-type embryos, Kupffer’s vesicle is large and prominent, lying below the end of the forming notochord. (B) In ntl mutant embryos, no vesicle forms, however boundaries between axial and paraxial mesoderm can be seen. (C) In flh mutant embryos, Kupffer’s vesicle often forms, but it is smaller and less regularly shaped than in wild-type embryos. Axial-paraxial boundaries are absent. (D,E) Expression of ntl RNA as a marker for forerunner cell development in wild-type (D) and ntl mutant (E) embryos. Dorsal views of the tailbud at the 2-3-somite stage; anterior extends to the right. (D) In wild-type embryos, ntl RNA is expressed in cells located posteriorly in the tailbud, and in the cells of the forming notochord (arrow). ntl RNA is also expressed by cells of the forerunner cluster that will form Kupffer’s vesicle, but this labeling is obscured by labeling in the overlying notochord rudiment. (E) In ntl mutant embryos, there is an absence of labeling in the axial mesoderm, so labeling in the forerunner cluster is obvious (arrowhead). Scale bar: 50 μm. EXPRESSION / LABELING:
PHENOTYPE:
|