
- Title
-
The expression pattern of two zebrafish achaete-scute homolog (ash) genes is altered in the embryonic brain of the cyclops mutant
- Authors
- Allende, M.L. and Weinberg, E.S.
- Source
- Full text @ Dev. Biol.

Northern blots of zebrafish embryonic and adult RNA hybridized with Zash probes. Zash-1a (top) and Zash-1b (bottom) anti-sense riboprobes were hybridized to a filter containing RNAs extracted from embryos at times (hr) indicated above each lane. The rightmost lane in each case contained poly(A)+ RNA from adult fish. A parallel gel containing the same samples was stained with ethidium bromide. The amounts of ribosomal RNA in each sample were equivalent, indicating that differences in hybridization were not due to variations of RNA loaded on the gel. |

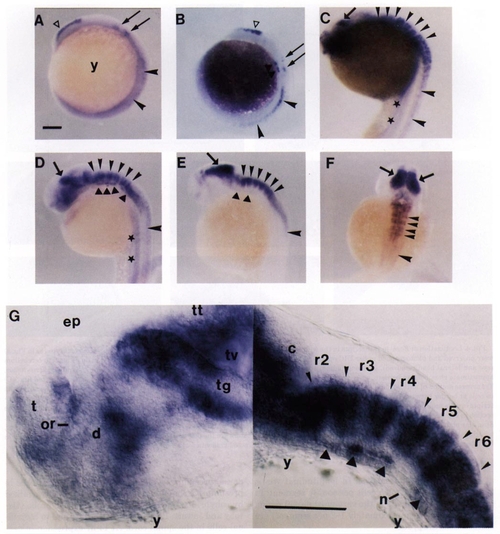
Zash-1a expression in wild-type embryos. 12-hr (A), 14-hr (B), 20-hr (C), 24-hr (D), 30-hr (E, F), and 26-hr (G) embryos were hybridized with a Zash-1a antisense probe. (A-E) Lateral views of whole-mounted embryos. (F) Dorsal view of a 30-hr whole-mounted embryo. (G) Lateral view of a thick longitudinal section of a 26-hr embryo (eyes and lateral head removed) observed by DIC optics (montage of three photographs taken at slightly different planes of focus). Symbols indicating expression sites: open triangles, ventral forebrain; asterisks, epiphysis; open stars, hindbrain-midbrain boundary; small arrowheads, rows of expressing cells in the dorsal hindbrain; open arrows, ventral cells near floor plate of cerebellum and rhombomere1; thin arrows, tegmentum; large arrowheads, cells outside CNS flanking anterior hindbrain; thick short arrows, neural retina; medium arrowheads, expressing cells in spinal cord; filled stars, diffuse staining near yolk and gut. Abbreviations: c, cerebellum; d, diencephalons; ep, epiphysis; h, hypothalamus; or, optic recess; o, otocyst; r1...r6, rhombomeres 1 through 6; t, telencephalon, tg, tegmentum; tt, tectum; tv, tectal vesicle, y, yolk. Scale bars in A and G, 100 μm (A-F at same magnification). EXPRESSION / LABELING:
|

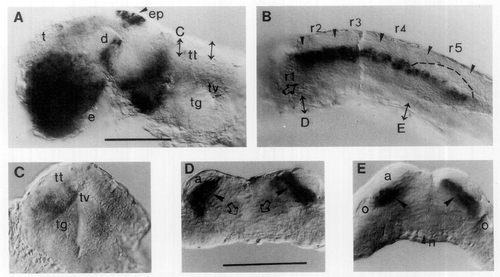
Localization of Zash-1a transcripts in the wild-type 24-hr CNS. Thick sections of whole mount in situ hybridized embryos (as in Fig. 3) were observed and photographed under DIC optics. (A) Longitudinal section of head showing region from anterior tip of head to cerebellum (eye and lateral head removed). (B) Longitudinal section of hindbrain extending from cerebellum to rhombomere 7. Symbols: arrowheads, approximate rhombomere borders; open arrow, transcripts in ventral region of rhombomere 1. Outline of otocyst is shown as dotted line. (C) Transverse section of anterior midbrain. (D-F) Transverse sections of rhombomeres 1, 4, and 7, respectively. Symbols: arrowheads, transcripts in cells at border between basal and alar plates; open arrows, as in (B). (G) Transverse section of midtrunk spinal cord, open triangles, transcripts in cells near floor plate. Planes of transverse sections (C-F) are indicated by the double-headed arrows in (A) and (B). Plane of transverse section in Fig. 9A is indicated in (A) by a double-headed arrow without an accompanying letter. Abbreviations (in addition to those used in Fig. 3): a, alar plate; drc, dorsorostral cluster; E, eye; F, floor plate; n, notochord; p, pituitary; s, spinal cord; so, somite; vec, ventrocaudal cluster; vrc, ventrorostral cluster; [dorsorostral, ventrocaudal, and ventrorostral clusters are the positions of early acetylcholinesterase-expressing cells in the telencephalon and diencephalons (Ross et al., 1993)]. Scale bars, 100 μm; magnification of (A-C) is identical, and that of (D-G) is identical. EXPRESSION / LABELING:
|
Zash-1b expression in wild-type embryos. 12-hr (A), 14-hr (B), 20-hr (C), 24-hr (D), 30-hr (E, F), and 26-hr (G) embryos were hybridized with a Zash-1b antisense probe. (A-E) Lateral views of whole-mounted embryos. (F) Dorsal view of a 30-hr whole-mounted embryo. (G) Lateral view of a thick longitudinal section of a 26-hr embryo (eyes and lateral head removed) observed by DIC optics (montage of two photographs taken at slightly different planes of focus). Symbols indicating expression sites: open triangles, dorsal telencephalon; thin arrows, early expression sites in dorsal zones of rhombomeres 2 and 4; closed triangles, expression sites in ventral regions of rhombomeres; larger arrowheads, expression in spinal cord; smaller arrowheads, bands of expressing cells in dorsal and intermediate hindbrain; thick short arrows, midbrain expression sites; filled stars, diffuse staining near yolk and gut. Abbreviations are as in the legend to Fig. 3. Scale bars in A and G, 100 μm (A-F at same magnification). EXPRESSION / LABELING:
|

Localization of Zash-1b transcripts in the wild-type 24-hr CNS. Thick sections of whole mount in situ hybridized embryos (as in Fig. 5) were observed and photographed under DIC optics. Sections are of same regions illustrated in Fig. 4. (A) Longitudinal section of head showing region from anterior tip of head to cerebellum (eye and lateral head removed). (B) Longitudinal section of hindbrain. Symbols: arrowheads, approximate rhombomere borders; arrows, fan- shaped expression zone in basal plate near rhombomere borders; filled triangles, ventral expression zone near floor plate. Outline of otocyst is shown as dotted line. (C) Transverse section of anterior midbrain. (D-F) Transverse sections of rhombomeres 1, 4, and 7, respectively. Symbols: arrows, fan-shaped expression zones in basal palate; arrowheads, border of this zone at the boundary between alar and basal plates; filled triangles, as in (B). (G) Transverse section of midtrunk spinal cord, one end of the double-headed arrows indicates highest level of transcripts in intermediate zone. Planes of transverse sections (C-F) are indicated by the double-headed arrows in (A) and (B). Plane of transverse section in Fig. 9C is indicated in (A) by a double-headed arrow without an accompanying letter. Abbreviations as in Figs. 3 and 4. Scale bars, 100 μm, magnification of (A-C) is identical, and of (D-G) is identical. EXPRESSION / LABELING:
|
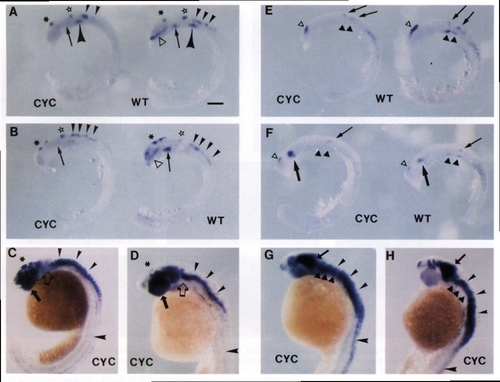
Zash-1a and Zash-1b expression in cyclops embryos. Zash-1a (A-D) or Zash-1b (E-H) antisense probes were hybridized to 14-hr (A, E), 18-hr (B, F), 24-hr (C, G), and 30-hr (D, H) embryos. In the 14- and 18-hr embryo panes, cyclops (on lef) and wild-type embryos (on right) are compared after removal of yolk. The 24- and 30-hr panes show only cyclops embryos (which can be compared to similarly hybridized wild-type embryos in Figs. 3 and 5). Symbols are exactly those used in Figs. 3 and 5, but in this case may point to expression sites which are absent in cyclops embryos. Scale bar in A, 100 μm (all panels at same magnification). EXPRESSION / LABELING:
PHENOTYPE:
|
Localization of Zash-1a transcripts in the cyclops 24-hr CNS. Sections are of same regions illustrated in Figs. 4 and 6. (A) Longitudinal section of head (eye is deeply embedded and cannot be removed with the lateral portion of the head). (B) Longitudinal section of hindbrain, outline of otic vesicle is shown as dotted line. (C) Transverse section of anterior midbrain. (D) Transverse section of rhombomere 1. (E) Transverse section of rhombomere 4. Planes of transverse sections (C-E) are indicated by the double-headed arrows in (A) and (B). Plane of transverse section in Fig. 9B is indicated in (A) by a double-headed arrow without an accompanying letter. Scale bars, 100 μm, magnification of (A-C) is identical, and that of (D and E) is identical. Symbols and abbreviations as in Fig. 4 except that open arrows now indicate absence of ventral expression zone in rhombomere 1. |

Localization of Zash-1a and Zash-1b transcripts in the posterior midbrain of 24-hr embryos. Transverse sections of wild-type (A, C) or cyclops (B, D) posterior midbrains of embryos hybridized with Zash-1a (A, B) or Zash-1b (C, D) probes. Planes of the sections are shown in (A) of each of Figs. 4, 6, 8, 10 as double-headed arrows (without a letter code) one side of which point to the tectum. Scale bar, 100 μm; magnification of all panels is identical. |

Localization of Zash-1b transcripts in the cyclops 24-hr CNS. Sections are of the same regions illustrated in Fig. 7. Note that the eye is deeply embedded in the cyclops embryos and cannot be completely removed with the lateral portion of the head in the longitudinal section of (A). Planes of transverse sections (C-F) are indicated by the double-headed arrows in (A) and (B). Plane of transverse section in Fig. 9D is indicated in (A) by a double-headed arrow without an accompanying letter. Scale bars, 100 μm, magnification of (A-C) is identical, and that of (D and E) is identical. Symbols are as in Fig. 6 except that filled triangles now indicate absence of ventral expression zone in rhombomeres 2, 3, 4, and 6. Abbreviations as in Figs. 4 and 6. |
Reprinted from Developmental Biology, 166, Allende, M.L. and Weinberg, E.S., The expression pattern of two zebrafish achaete-scute homolog (ash) genes is altered in the embryonic brain of the cyclops mutant, 509-530, Copyright (1994) with permission from Elsevier. Full text @ Dev. Biol.