
- Title
-
Ectopic expression of Hoxa-1 in the zebrafish alters the fate of the mandibular arch neural crest and phenocopies a retinoic acid-induced phenotype
- Authors
- Alexandre, D., Clarke, J.D.W., Oxtoby, E., Yan, Y.L., Jowett, T., and Holder, N.
- Source
- Full text @ Development

Expression pattern of Hoxa-1 in whole-mount in situ hybridisations. (A,B) 50% epiboly. A is the view from the animal pole dorsal side towards the bottom, B is the same embryo as in A but tilted to show more of the dorsal side. (C,D) About 70% and 80% epiboly respectively, viewed from the dorso-vegetal side, note the broadening of the domain of expression towards the vegetal pole and also the closing of the gap at the dorsal midline. (E,F) 100% epiboly. E is a dorsal view and F is the same embryo viewed form the side, dorsal to the right and rostral end of the embryo is at the top. (G,H) Progressively older embryos after the tailbud stage viewed from the dorsal side. Note the sharp anterior boundary of the expression domain and the increase in signal at the dorsal midline where the cells are converging to form the spinal cord. (I,J) 20 hour old embryo showing the strong signals from the spinal cord, the endoderm (arrowheads), the tailbud, the regions perpendicular to the A/P body axis at the level of the otic vesicle. (K-O) Embryos in a sequence from 10 to 16 hours showing the expression of Hoxa-1 and krx-20. The boundary of Hoxa-1 at the time krx-20 first expresses is just caudal to r3. By 16 hours, this rostral Hoxa-1 boundary has receded to the spinal cord/hindbrain border. Expression can be seen in the lateral regions of r4 prior to the signal receding – arrowed in M. Scale bar, 100 μm. EXPRESSION / LABELING:
|

Retinoic acid causes the ectopic expression of Hoxa-1. (A-C) Pairs of embryos that have hybridised to probes to Hoxa-1 and pax 2 under indentical conditions. The embryos on the right of each pair have been treated with RA on the onset of gastrulation. At this dose of RA, Hoxa-1 is ectopically expressed by 70% epiboly (A) in the axial midline (black arrow) and around the germ ring as seen from the animal pole. By the 1-somite stage (B - tilted animal pole view) pax 2 (white arrow) is first expressed in the prospective midbrain and, by this stage, the rostral limit of the Hoxa-1 signal in the treated embryos is no further anterior than in the control. A small patch of ectopically expressed Hoxa-1 lies anteriorly (black arrow). (C) The same embryo as seen in B but viewed laterally with anterior to the top and dorsal to the right. The white arrow indicates the normal pax 2 expression and the black arrow the ectopic Hoxa-1 expression which is in the prechordal mesoderm. (D-F) A series of high power views of optical sections through the midline of treated embryos showing ectopic expression of Hoxa-1 only in the hypoblast. (D) Ectopic expression is evident at the late shield stage. (E) Ectopically expressing cells are seem to be in the hypoblast. (F) The same embryo as that shown in B and C. Ectopic expression is present in the prechordal mesoderm. The arrow indicates the anterior extent of the normal expression of Hoxa-1 in the ectoderm. pcm, prechordal mesoderm; h, hypoblast; e, ectoderm. Scale bar, 100 μm. |

Embryo at the 132- cell stage hybridised with a probe to pSP64T vector sequences following injection of Hoxa-1 synthetic RNA into the fertilised egg. The RNA distributes to approximately one third of the blastomeres in this case. Scale bar, 100 μm. |

Photomicrographs of the anterior hindbrain region of 20 h embryos hybridised with a probe for krx-20. (A) Control showing krx-20 expressing in r3 and r5. (B,C) Examples of embryos injected with mouse Hoxa-1 RNA at the single cell stage. r5 is normal in both cases but r3 expression of krx-20 is abnormal. The anterior hindbrain appears distorted; thus r3 is split dorsally in B and is laterally displaced in C. Ectopic regions of krx-20 expression, such as that arrowed most anteriorly in C, were occasionally seen. Scale bar, 100 μm. EXPRESSION / LABELING:
|
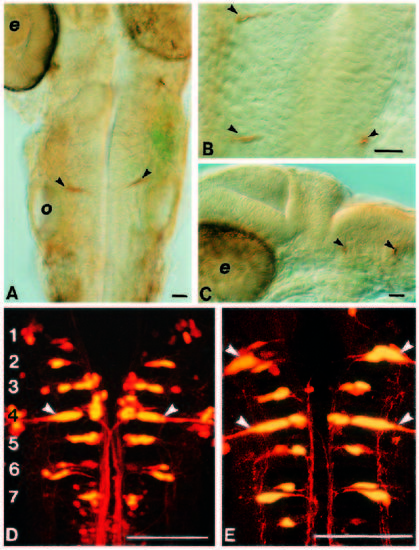
Duplication of the Mauthner neuron occurs in r2 in Hoxa-1- injected embryos. (A-C) 24 hour old embryos stained with the 3A10 antibody. In control embryos (A), a single pair of Mauthner cells is evident in r4 (arrowheads). In injected embryos (B,C), an additional Mauthner cell is seen more rostrally. Anterior is up in A and B and to the left in C. (D,E) Confocal images of hindbrains from larvae that have had lysinated rhodamine dextran crushed onto their spinal cords in order to retrogradely label reticulospinal neurons. (D) Control with the different rhombomeres (numbered) evident from the segmental arrangement of the neurons. The Mauthner neurons is arrowed. Duplicated Mauthner cells are evident in r2 in the injected embryo shown in E. o, otic vesicle; e, eye. Scale bar, 100 μm. EXPRESSION / LABELING:
|
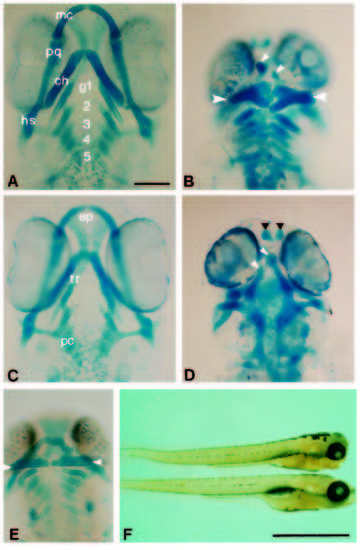
Hoxa-1 overexpression causes abnormal development of the head skeleton as shown in ventral views of alcian blue-stained larvae. (A) Control larva. The Meckel’s (mc) and palatoquadrate (pq) cartiliages are formed from the first pharyngeal arch mesenchyme. The ceratohyals (ch) and hyosymplectics (hs) are formed from the second arch mesenchyme. The gill arches (g) are shown by numbers. (B) A larva which was injected with Hoxa-1 RNA showing abnormal development of the jaws. The first arch derivatives are absent and a broadened pair of ceratohyals are formed (large arrowheads). Small arrowheads indicate the tip of the abnormally formed trabeculae. (C) Control larva showing the ventral neurocranium. The anterior ethmoid plate (ep), trabeculae (tr) and posterior parachordals (pc) are evident. (D) Dorsal view of the same embryo as in (B). The trabeculae are malformed (white arrowheads), the ethmoid cartilages exist as separate pieces anteriorly (black arrowheads) and the parachordals are normal. (E) A larva that was treated with RA at the onset of gastrulation showing the abnormally formed jaws. The forked ceratohyals are arrowed. (F) Two larvae showing the formation of the jaws at 4 days. The top one has been injected with Hoxa-1 and lacks the protruding jaws evident in the control larva below. Scale bar, 100 μm (A-E) or 1 mm (F). |
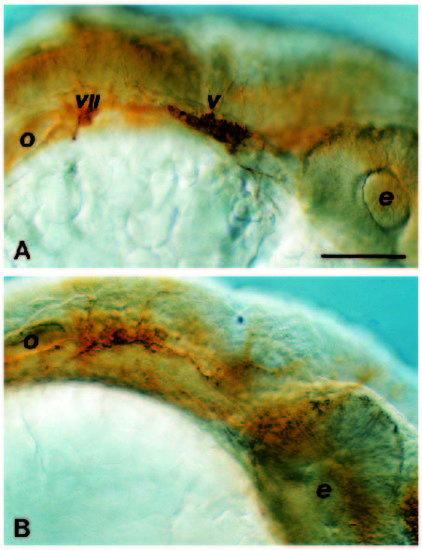
The preotic cranial ganglia are abnormally formed in Hoxa-1- injected embryos. This is seen by comparing 24 hour embryos stained with anti-acetylated tubulin to reveal the VIIth and Vth ganglia between the otic vesicle (o) and the eye (e). In control embryos (A), these ganglia are distinct but, in embryos injected with Hoxa-1 (B), they are reduced and fused into one ganglion immediately anterior to the otic vesicle. Scale bar, 100 μm. |

(A) A 16 somite control embryo probed for expression of dlx2. Anterior to the left and dorsal up. Three streams of neural crest cells can be seen on the lateral regions of the neural keel two of which lie anterior to the otic placode (op). The anteriormost stream migrates into the mandibular arch and the preotic stream into the hyoid arch (see Akimenko et al., 1994). (B) dlx2 expression in a 16-somite-staged embryo injected with Hoxa-1. Only one preotic stream of crest is now visible and it is larger than in controls. This aberrant stream of crest lies immediately anterior to the otic placode and the most anterior stream of crest is absent. (C) The positioning of the aberrant stream is confirmed in embryos probed for both dlx2 (blue) and krx-20. (red). In this 16-somite example, the single preotic stream stretches round the margin of the abnormally formed r3. Scale bar, 100 μm. EXPRESSION / LABELING:
|