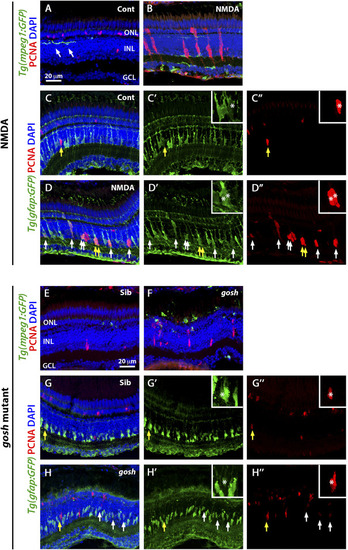
Acute and chronic damaged retinas induce microglia activation and Müller glia proliferation. At 3 wpf, undamaged Tg(mpeg1:eGFP) fish retinas display few thin and ramified microglia/macrophages (arrows) and PCNA-positive cells in the ONL and INL, corresponding to rod precursors and Müller glia/NPCs, respectively (A). In contrast, 72 h after NMDA injection of Tg(mpeg1:eGFP) fish, microglia/macrophages increase in numbers and ameboid-shaped, migrate to the inner retina, and express PCNA strongly in the INL (B). Forty-eight hours after injection, control and NMDA-injured Tg(gfap:eGFP) retinas exhibit eGFP expression in Müller glia cell bodies and apical-basal extended processes (CD”). Control retinas possess relatively few PCNA-positive Müller glia resulting from persistent neurogenesis (arrow, CC”), while NMDA-injured retinas display increased numbers of proliferating Müller glia (arrows, DD”). Similar to control retinas, 3 wpf control gosh sibling retinas possess some ramified microglia/macrophages and few PCNA-positive cells (E), while gosh mutant retinas have activated microglia/macrophages in the ONL (F). The control gosh sibling retinas display proliferating Müller glia and ONL cells (GG”), as did the gosh mutant retinas (HH”, arrows). All sections are counterstained with DAPI to visualize the three nuclear layers. Arrows in (CD”) and (GH”) identify PCNA and eGFP colabeled cells; yellow arrows: identify cells shown in the insets; asterisks in the insets: PCNA and eGFP colabeled cells; ONL, outer nuclear layer; INL, inner nuclear layer; GCL, ganglion cell layer.

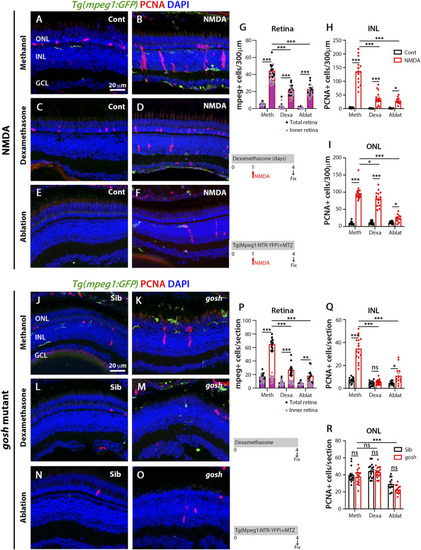
Suppressing microglia affect Müller glia proliferation in NMDA-injured retina and gosh mutants. At 72 h after control injection, 3 wpf wild-type Tg(mpeg1:eGFP) retinas display few thin and ramified microglia/macrophages through the retina and PCNA-positive cells in the ONL and INL, corresponding to rod precursors and Müller glia/NPCs, respectively (A). At 72 h following NMDA injection, microglia/macrophages increase in numbers in the inner retina, and PCNA expression is strongly stimulated (B). Control and NMDA-damaged retinas were treated with dexamethasone (C,D) or microglia/macrophages ablated with the mpeg1:NTR-eYFP transgene and metronidazole (E,F). Compared to methanol-treated control retinas, NMDA-damaged retinas possess significantly fewer microglia/macrophages (G) and PCNA-positive INL and ONL cells (H,I, respectively) following either dexamethasone or ablation treatment. Control gosh sibling retinas display some ramified microglia/macrophages and few PCNA-positive cells (J). gosh mutant retinas have activated microglia/macrophages in the ONL and PCNA-expressing INL and ONL cells (K). Sibling control and gosh mutant retinas were treated with dexamethasone (L,M) or microglia/macrophages were ablated (N,O). Compared to methanol-treated controls, dexamethasone treatment (M) or microglia/macrophage ablation (O) significantly reduces the number of microglia/macrophages (P) and PCNA-positive INL and ONL cells (Q,R, respectively). Histograms display the number of eGFP-positive microglia/macrophages (G) and PCNA-labeled cells (H,I) in 300 μm of the central region of the NMDA-damaged retinas or in the entire section of gosh mutant retinas (PR). Bars and lines indicate mean ± SEM, n = 12–17. Black bars: control retinas; red bars: NMDA-injected or gosh mutant retinas. Panels (G,P): black dots display total number of mpeg:GFP + cells in the retina, and pink dots show total number of mpeg:GFP + cells in the inner retina. One-way ANOVA with Tukey’s multiple comparisons test was applied for all the graphs (ns p > 0.05; *p < 0.05; **p < 0.001; ***p < 0.001).

LPS-activated microglia enhance Müller glia proliferation in NMDA-injured retina and gosh mutant. Three wpf Tg(mpeg1:eGFP) fish with either PBS (AC) or LPS (BD) and injected 3 h slater with either buffer (A,B) or NMDA (CE) and collected 69 h later for immunostaining. Microglia/macrophages are visualized with the transgenic line. LPS-treated control retinas display a significantly greater number of PCNA-positive ONL cells compared to control retinas (A,B,H). LPS-treatment of NMDA-damaged retinas significantly increases the numbers of activated microglia/macrophages and proliferating cells compared to PBS-injected NMDA-injured retinas (C,D,FH). LPS-treatment of NMDA-damaged retinas with ablated microglia/macrophages display significantly fewer microglia/macrophages and PCNA-positive cells (EH). LPS-injected gosh mutant eyes significantly increase microglia/macrophages reactivity and PCNA-labeled INL and ONL cells (K,L,NP). LPS-injected gosh mutant fish with ablated microglia/macrophages possess significantly fewer microglia/macrophages and PCNA-positive cells (MP). Histograms display the quantification of the number of eGFP-positive microglia/macrophages (F) or PCNA-labeled cells (G,H) in 300 μm of the central region of the NMDA-damaged retinas or in the entire section of gosh mutant retinas (NP). Bars and lines indicate mean ± SEM, n = 12–17. Black bars: PBS injection; green bars: LPS injection; green bars with purple fill: LPS and ablated microglia/macrophages. Panels F and N: black dots display total number of mpeg:GFP + cells in the retina, and pink dots show total number of mpeg:GFP + cells in the inner retina. Two-way ANOVA with Tukey’s multiple comparisons test was applied for all the graphs (ns p > 0.05; *p < 0.05; **p < 0.01; ***p < 0.001).

The acute injury model induces pro-inflammatory cytokine gene expressions that switch to anti-inflammatory cytokine expressions, whereas chronic injury shows the simultaneous expression of pro-inflammatory and anti-inflammatory gene expressions. Quantitative real-time PCR was used to determine the fold-change of mRNA expressions of mpeg1 and p2ry12(AD); il-1β, tnfα, and tnfβ(BE); il-10, tgf-β1, ccr2, and arg1(C,F) in NMDA-damaged retinas (AC) and gosh mutant retinas (DF) at 3 wpf. There is significant upregulation of mpeg1 and p2ry12 in acute and chronic injured eyes (A). The time course of NMDA-damaged retinas depicts an early il-1β peak, followed by stimulation of tnfα and tnfβ gene expressions, which then decreases within 1 week (B). Anti-inflammatory cytokine gene expressions are induced from 24 hpi, and levels are back to control at 1 week, except for tgf-β1 that always remains at basal levels (C). gosh mutants display a small, but significant upregulation of pro-inflammatory cytokine gene expressions, whereas anti-inflammatory cytokines are upregulated (DF). Graphs represent the mean value of two to three independent experiments ± SEM. For NMDA experiments, a One-way ANOVA with Dunnett’s multiple comparisons test was employed, for gosh mutants, an unpaired Student’s t-test was applied. Statistical significance between bars is indicated *p < 0.05, **p < 0.01, ***p < 0.001.

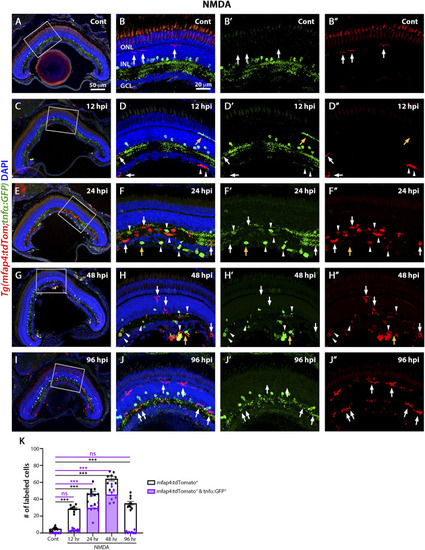
M1-like pro-inflammatory microglia are transiently identified in the NMDA-damaged acute injury model. Double-transgenic fish Tg(mfap4:tdTomato;tnfα:GFP) were used to monitor M1-like pro-inflammatory microglia/macrophages. Confocal images show 3 wpf control retinas possess tdTomato-positive ramified microglia (arrows), while amacrine cells express GFP (A,BB”). NMDA-injured retinas were evaluated at 12, 24, 48, and 96 h post-injection (hpi, CJ). At 12 h following NMDA injection, mfap4:tdTomato-positive microglia/macrophages start to co-express GFP (arrowheads). GFP-positive microglia/macrophages are detectable up to 72 hpi, but they are no longer detectable by 96 hpi. White boxes in Panels A, C, E, G, I show the area magnified in Panels B, D, F, H, J. White arrows: tdTomato-positive, GFP-negative microglia/macrophages; yellow arrows: tdTomato-negative, GFP-positive microglia/macrophages; arrowheads: tdTomato and GFP double-positive microglia/macrophages. Histogram displays the number of microglia/macrophages in 300 μm of the central region of the NMDA-damaged retinas (K). Bars and lines indicate mean ± SEM, n = 8–12 per group. Black bars: total number of tdTomato-positive cells; purple bars: tdTomato and GFP double-positive microglia/macrophages. Statistical analysis was performed with a One-way ANOVA with Tukey’s multiple comparisons test was applied (*p < 0.05; **p < 0.001; ***p < 0.001).

The gosh mutant chronic injury model possesses a small population of M1-like pro-inflammatory microglia/macrophages. At 3 wpf, control gosh sibling retinas display few and ramified tdTomato-expressing microglia/macrophages (AB”, arrows). In contrast, gosh mutant retinas exhibit many ameboid microglia/macrophages in the ONL and outer segments layers, with only a few of these microglia/macrophages co-expressing GFP (CD”, arrowheads). White boxes in Panels A and C show the area magnified in Panels (B,D). White arrows: tdTomato-positive, GFP-negative microglia/macrophages; arrowheads: tdTomato and GFP double-positive microglia/macrophages. Histogram displays the number of microglia/macrophages in the entire section of the retinas (E). Bars and lines indicate mean ± SEM, n = 11 per group. Black bars: total number of tdTomato-positive cells; purple bars: tdTomato and GFP double-positive microglia/macrophages. One-way ANOVA with Tukey’s multiple comparisons test was used for statistical analysis (*p < 0.05; ***p < 0.001).

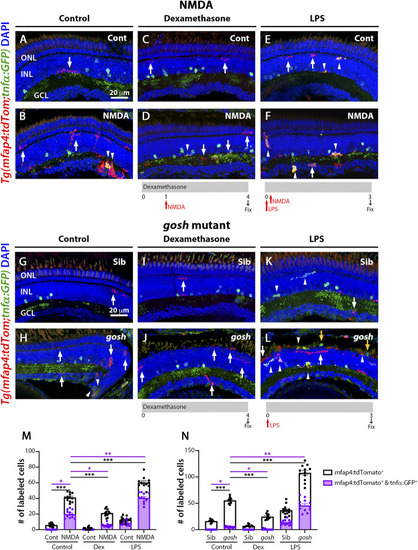
M1-like microglia are modulated by dexamethasone and LPS treatment in acute and chronic damaged retinas. At 3 wpf, Tg(mfap4:tdTomato;tnfα:GFP) fish, which allow visualization of M1-like pro-inflammatory retinal microglia/macrophages, were intravitreally injected with buffer (A,C,E) or NMDA (B,D,F). A group of fish were placed in Dexamethasone, intravitreally injected with either buffer or NMDA 24 h later, and collected 72 h following the injections for immunostaining (C,D). Alternatively, the fish were intravitreally injected with LPS, intravitreally injected 3 h later with either buffer or NMDA and collected 69 h later for immunostaining (E,F). Control retinas possess some ramified tdTomato-positive microglia/macrophages (A, arrow). NMDA-injured retinas show significantly greater number of tdTomato-positive microglia/macrophages and tdTomato-positive cells that co-express GFP from the tnfα:GFP transgene (B, arrowhead; M). Dexamethasone treatment significantly reduces the number of tdTomato-positive microglia/macrophages and tdTomato-positive cells that co-express GFP (D, arrowhead; M). LPS treatment significantly increases the number of tdTomato-positive microglia/macrophages and tdTomato cells that colabel with GFP in control and NMDA-damaged retinas (E,F, arrowheads; M). gosh mutants display ameboid tdTomato-positive microglia/macrophages, and some also co-express GFP (H, arrowheads; N). Dexamethasone treatment significantly reduces the number of tdTomato-positive microglia/macrophages and tdTomato-positive cells that co-express GFP in control siblings (I,N) and gosh mutants (J,N). LPS injection significantly increases the number of tdTomato-positive microglia/macrophages and GFP/tdTomato-double-positive cells in controls (K, arrows; N) and gosh mutants (L, arrowheads; N). White arrows: tdTomato-positive, GFP-negative microglia/macrophages; yellow arrows: tdTomato-negative, GFP-positive microglia/macrophages; arrowhead: tdTomato, GFP double-positive microglia/macrophages. Histograms represent the number of tdTomato-positive microglia/macrophages in 300 μm of the central region of the NMDA-damaged retinas (M) or the entire section of the gosh retinas (N). Bars and lines indicate mean ± SEM, n = 10–13 per group. Black bars: total number of tdTomato-positive cells; purple bars: tdTomato and GFP double-positive microglia/macrophages. Statistical analysis was performed with One-way ANOVA with Tukey’s multiple comparisons test on both graphs (*p < 0.05; **p < 0.01, ***p < 0.001).

Model of inflammation regulating the regenerative response in acute and chronic retinal damage in zebrafish. Diagram representing microglia/macrophages activation and polarization upon NMDA-acute injury or gosh chronic mutant retinal damage in zebrafish to induce regeneration. This acute injury model stimulates an early pro-inflammatory response, which then switches to an anti-inflammatory profile. This chronic injury model stimulates a dominant anti-inflammatory response, accompanied by a mild pro-inflammatory response. Modulating inflammation can inhibit or amplify the regeneration capacity via regulating the presence of M1-like pro-inflammatory microglia/macrophages.

Acknowledgments
This image is the copyrighted work of the attributed author or publisher, and ZFIN has permission only to display this image to its users. Additional permissions should be obtained from the applicable author or publisher of the image. Full text @ Front Cell Dev Biol