
- Title
-
Sexual dimorphic effects of igf1 deficiency on metabolism in zebrafish
- Authors
- Zeng, N., Bao, J., Shu, T., Shi, C., Zhai, G., Jin, X., He, J., Lou, Q., Yin, Z.
- Source
- Full text @ Front Endocrinol (Lausanne)
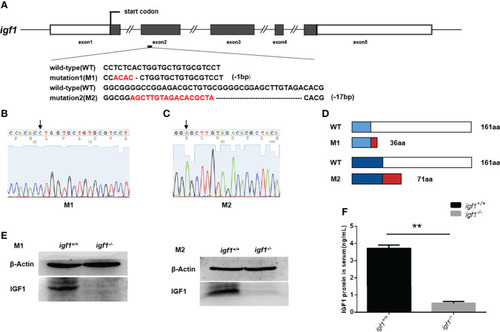
Generation of |
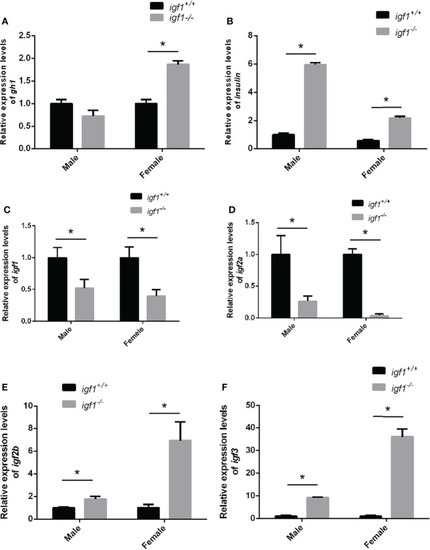
Feeding-back transcriptional levels of igf1 gene |
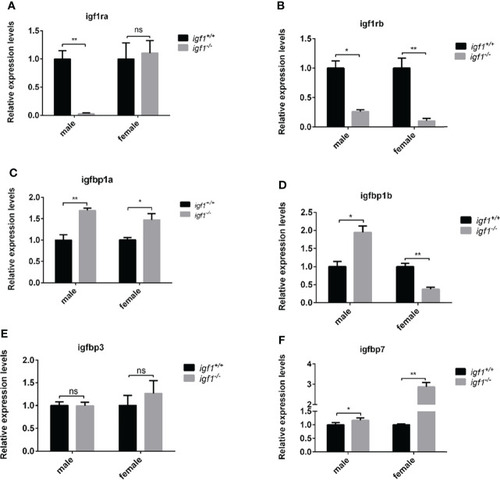
Transcriptional levels of igf1 related genes |
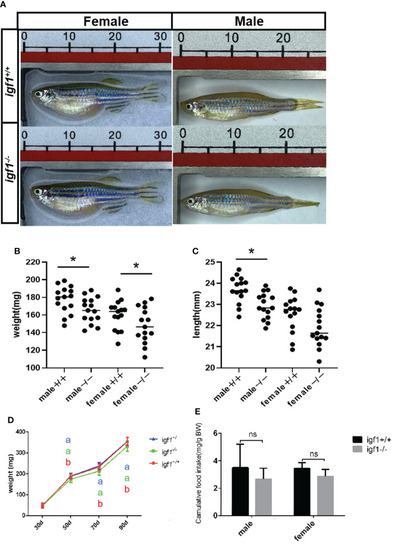
General growth performance traits of PHENOTYPE:
|
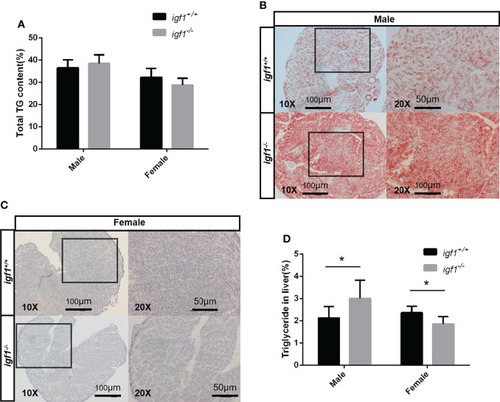
Hepatic steatosis observed in PHENOTYPE:
|
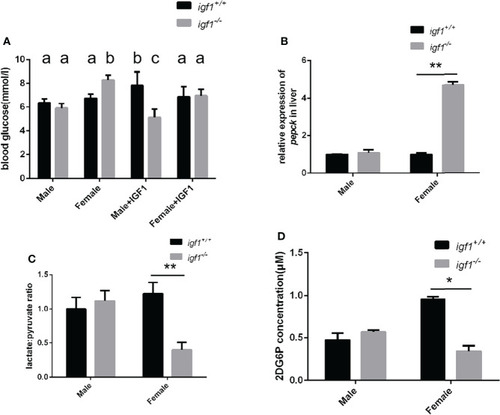
Alterations of glucose metabolism in |

The phosphorylation levels of several key kinases in the hepatic tissue of |

E2 rescue the hepatic steatosis and the AKT-mTOR signaling activity in liver. |