
- Title
-
Characterization of the Interrenal Gland and Sexual Traits Development in cyp17a2-Deficient Zebrafish
- Authors
- Shi, S., Shu, T., Li, X., Lou, Q., Jin, X., He, J., Yin, Z., Zhai, G.
- Source
- Full text @ Front Endocrinol (Lausanne)
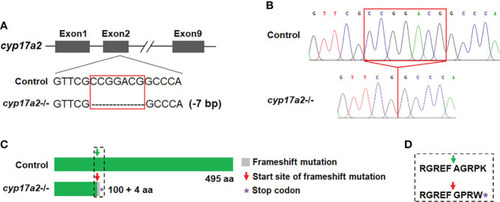
Deletion of |

|
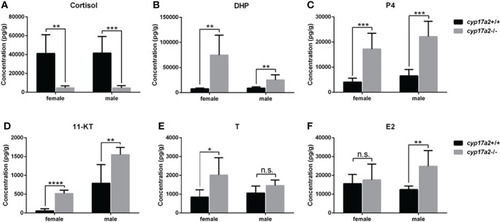
The steroid measurements. Whole-body levels of cortisol |

|

The analyses of primary and secondary sex characters and fertility assessment. |

The over-activated oocytes in |

Expression profiles of pituitary hormones. Expressions of |