
FIGURE SUMMARY
- Title
-
Recapitulation of Retinal Damage in Zebrafish Larvae Infected with Zika Virus
- Authors
- Maleski, A.L.A., Rosa, J.G.S., Bernardo, J.T.G., Astray, R.M., Walker, C.I.B., Lopes-Ferreira, M., Lima, C.
- Source
- Full text @ Cells
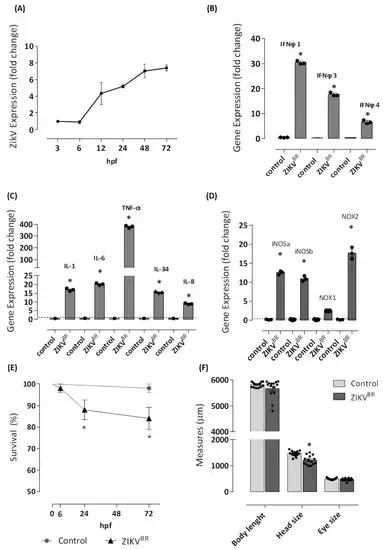
Figure 1. ZIKV infects one-cell stage embryo. The infection (n = 98) was performed by microinjecting embryos at 0 hpf with approximately 2 or 3 nL of ZIKVBR (1 × 10⁷ PFU/mL, 2 a.p.) utilizing a M205C stereomicroscope coupled with an Injectman® 4 microinjector. Another group (n = 83) was left without injection and formed the negative control group. Embryos were incubated in E2 0.5× medium at 28 °C, and viral RNA extracted from entire larvae was used for measurements via real-time quantitative PCR (qRT-PCR) after 3, 6, 12, 24, 48, and 72 hpf of the Zika viral load (A). Then, 72 hpf-infected larvae were sampled for qRT-PCR analysis of (B) IFNφ1, IFNφ3, and IFNφ4. cDNA was used in qRT-PCR reaction using primers specific for zebrafish, IL-1, TNF, IL-6, IL-8, and IL-34 (C), and iNOSa, iNOSb, NOX1, and NOX2 (D). The relative expression was normalized to the expression of EF-1a or GAPDH, and it is expressed as fold induction relative to the expression level in the control group (dotted line). For the analysis of gene expression, genes with fold change ≥1.5 were considered differentially expressed. ZIKV infection led to 14 and 16% of mortality (E), and a reduction of 17% of the head size was observed in ZIKV-injected larvae (F). Each bar represents the mean ± SEM. * p < 0.05 compared with the negative control group.
|

Figure 2. ZIKV infection of one-cell stage embryo changes locomotor activity behavior. The 96 hpf larvae infected with ZIKVBR at 0 hpf or control group were distributed in a 96-well plate (1 larva/well), and the locomotor activity was analyzed in Zebrabox system. The larvae were exposed to an incubation period of 30 min in the light (lux: 12%) followed by the testing phase consisting of a dark stimulus (lux: 0%) for 1 s, alternated by 29 s in the light (lux: 12%) for 2.5 min to induce visual stimulation and the startle response. The total distance moved (mm) by each group during the testing period (A) and the average velocity of each group in mm/s are shown in (B). Graphical representation of larvae tracking during the testing phase (C). The lines represent the distance moved by the larvae at each second during the total experiment period with highlights of testing phase (D). Each bar represents the mean ± SEM. * p < 0.05 compared with the negative control group.
|
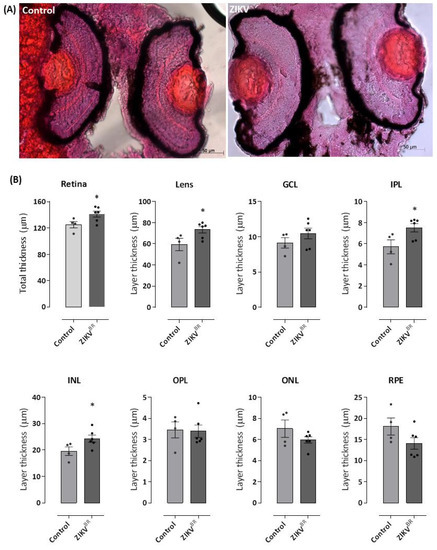
Figure 3. ZIKV causes an increase in the thickness of the zebrafish retina, especially in the lens and inner nuclear layer. The 96 hpf larvae infected with ZIKVBR at 0 hpf or control group were fixed, dehydrated and rehydrated, incubated in 30% sucrose, and were mounted in OCT. Then, 18 μm-thick cryosections were stained with H&E. The images obtained under an optical microscope show an increased retinal layer thickness in ZIKV-infected larvae (A,B), which is most evident in the lens region. Red dots in the eyes of the control animals do not represent any morphological changes or developmental malformations. All measures were made in ImageJ software. GCL = ganglion cell layer; INL = inner nuclear layer; ONL = outer nuclear layer; IPL = inner plexiform layer; OPL = outer plexiform layer; RPE = retinal pigment epithelium. Each bar represents the mean ± SEM. * p < 0.05 compared with the negative control group.
|

Figure 4. ZIKV replicated in zebrafish was able to infect healthy larvae. The supernatants obtained after centrifugation of the lysate from the 72 hpf ZIKV-infected larvae or control larvae were injected in 72 hpf healthy larvae into the yolk (2 nL) or diluted in E2 0.5× medium (0.04%). After 24 h, larvae were distributed in a 96-well plate (1 larvae/well), and the locomotor activity was analyzed in Zebrabox system. The larvae were exposed to an incubation period of 30 min in the light (lux: 12%) followed by the testing phase consisting of a dark stimulus (lux: 0%) for 1s, alternated by 29s in the light (lux: 12%) for 2.5 min to induce visual stimulation and the startle response. The total distance moved (mm) of each group during the testing period and the average velocity (mm/s) of each group are shown in (A,B). Graphical representation of the larvae tracking during the testing phase (C). The lines represent the distance moved by the larvae at each second during the total experiment period with highlights of testing phase (D). * p < 0.05 compared with the negative control group.
|
Acknowledgments
This image is the copyrighted work of the attributed author or publisher, and
ZFIN has permission only to display this image to its users.
Additional permissions should be obtained from the applicable author or publisher of the image.
Full text @ Cells