FIGURE SUMMARY
Title

A Combined Human in Silico and CRISPR/Cas9-Mediated in Vivo Zebrafish Based Approach to Provide Phenotypic Data for Supporting Early Target Validation

Authors
Winter, M.J., Ono, Y., Ball, J.S., Walentinsson, A., Michaelsson, E., Tochwin, A., Scholpp, S., Tyler, C.R., Rees, S., Hetheridge, M.J., Bohlooly-Y, M.
Source
Full text @ Front Pharmacol

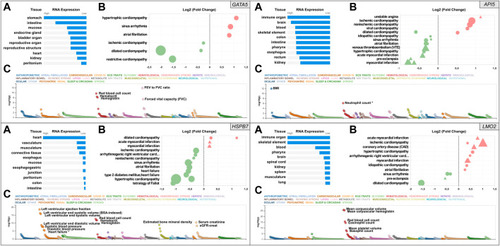
Snapshot of the results from the in silico assessment of the heart failure candidate genes API5 (top right), HSPB7 (bottom left), LMO2 (bottom right), and positive control gene GATA5 (top left panel). (A). The top 10 tissues showing expression based on RNA sequencing data from the Human Protein Atlas (HPA) and EMBL-EBI Expression Atlas as summarized by Open Targets Platform (https://www.targetvalidation.org). (B). Gene expression changes in cardiovascular disease conditions based on publicly available transcriptome studies from NCBI Gene Expression Omnibus (GEO). Disease conditions are shown on the Y-axis and log2 fold changes (vs. normal controls) on the X-axis. Icons are coloured by direction of change; red and green represent up- and downregulation in that disease, respectively. Icon shapes represent tissue type subjected to transcriptomics; circles and triangles represent heart and blood, respectively. Finally, icon size reflects statistical significance; the larger the icon the lower the p-value. All findings shown are significant (Adjusted p-value<0.05). (C). Common variant gene locus association data from 190 datasets and 251 traits in Common Metabolic Diseases Knowledge Portal (CMDKP). Traits considered genome-wide significant (p-value ≤ 5 × 10⁻⁸) are highlighted (border-line significant traits are marked with *).

Mutation efficiency of the gRNAs for each candidate gene. Data for gata5 are shown in top left panel, api5 in top right panel, hspb7 in bottom left panel, and lmo2 in bottom right panel. In each panel, the upper gel images show the bands obtained following targeted PCR of genomic DNA extracted from four individual animals injected with the two most effective CRISPR gRNAs + Cas9 (based on 2 dpf morphological analysis), compared with the Cas9 injected control animals. The lower gel images show the same samples following T7E1 assay undertaken to reveal the cleavage of heteroduplex DNA. The chromatogram images in the middle of each panel show the result of Sanger sequencing undertaken on representative genomic DNA samples from the most effective gRNA + Cas9, per gene, compared with that from a representative Cas9-injected control animal. The lower scatter plot graphs in each panel show the indel size and frequency in the PCR products from most effective gRNA + Cas9 group (n = 4) per gene. Data points with same colour indicate the indels identified in the same individual embryo within the group. The size ranges of deletions between gRNA target sites are shaded. Indels with less than 5% frequency are presented by open circles. Note in all cases the most effective gRNA was the combined guide group (g#1,2,3) except for lmo2 which, due to high mortality in the g#1,2,3 group, the g#2-injected animals were selected for full analysis.

Results of the morphological analysis of 4 dpf gata5 (positive control), api5, hspb7 and lmo2 zebrafish crispants vs. the Cas9-injected control animals. Panel (A): General whole body morphological endpoints measured following injection of Cas9 alone, or after mutation of each of the genes assessed. Data are shown as the % incidence of abnormalities under each category, with shades from white (0%) through to red (100%) providing an indication of the proportion of animals exhibiting a malformation within that category. Note different n-numbers present as two runs were undertaken for the Cas9 control and the gRNA + Cas9-injected group showing the most robust phenotype from run 1 (for lmo2 g#2 was run twice due to concerns about excessive mortality in the g#1,2,3 group). The guide combination used for two runs in each case is shown in the lower panel of the example images for each gene. Ai: Expansion of heart-specific endpoints showing the full range scored including estimates of the size of pericardial oedema. Data are shown as the mean, ±SEM and (n = number of measures possible) for each treatment, For these data, **signifies a statistically significant difference vs. the Cas9 control at p < 0.01, and *** at p < 0.001 (t-test or Mann Whitney U-tests for the combined guide injected groups, or 1-way ANOVA and Tukey’s HSD tests or Kruskal–Wallis and Dunn’s tests for the single guide injected groups, in which run 1 and 2 data were combined). (B): example larvae following gata5 mutation vs. the Cas9-injected control. The yellow arrows indicate the position of the pericardial membrane and the extent of pericardial oedema, which was minimal in the controls but extensive in most crispant animals (two examples are shown for g#1-injected animals as there was some variability in the severities seen). (C–E): examples of larvae following knockout of each of the other genes assessed (note the apparent lack of effect of api5 mutation on general morphology). The scale bar shown in the first image of panels B–E represents 500 μm.

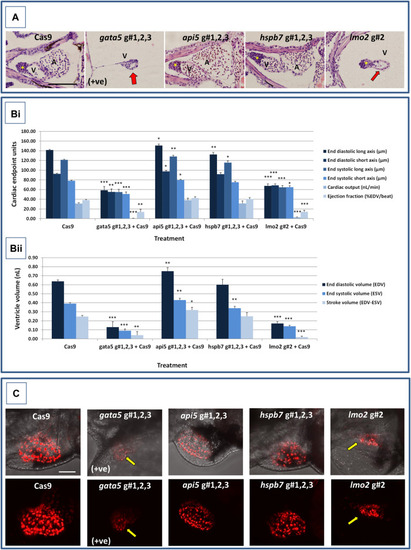
Results of the cardiac pathological analysis of 4 dpf gata5 (positive control), api5, hspb7 and lmo2 zebrafish crispants vs. the Cas9-injected control animals. Panel (A) Example haematoxylin and eosin stained coronal sections through the heart (top, A = atrium, V = ventricle, *bulbous arteriosus) from each of the treatment groups vs. the Cas9-injected controls (left-hand panels). Note in particular the extreme cardiac hypoplasia after gata5 and lmo2 mutation (indicated by a red arrow in the images) in which the atrium is not visible probably due to the severe pericardial oedema and resultant distension of the heart muscle. In each panel, animals are orientated with the head to the left, and viewed in the dorsal plane at a magnification of ×40 (the scale bar shown in left-hand image represents 200 μm). Panel B) Results of the analysis of ventricular dimensional analysis of the crispant vs. Cas9 control animals. Shown are the ventricle dimensions and cardiac functional parameters, calculated from the measurement of ventricle dimensions in 5 randomly selected embryos from each of the two runs undertaken on each gene. Panel (Bi) shows a graph of the ventricle diameter, cardiac output and ejection fraction data, and Panel (Bii) a graph of the ventricle volume-related measurements. In all cases data are shown as the mean and ±SEM of the animals in each group (n = 10 per group except n = 9 for the gata5 cardiac output data due to the absence of a heart beat in one animal). For brevity the Cas9 data are shown as the mean across all 4 Cas9 datasets (n = 40 animals), however, statistical analysis was undertaken on the crispants versus the corresponding Cas9 control data in each case. *signifies a statistically significant difference vs. the Cas9 control for that parameter at p < 0.05, ** at p < 0.01, and *** at p < 0.001 (Student’s t-test or Mann Whitney U-tests). Note: the overall body lengths of the gata5 and the lmo2 crispants were also significantly reduced (p < 0.001). Panel (C) Example images of hearts from cmlc2:DsRed2-nuc larvae in which the cardiomyocytes are labelled red, especially prominently in the ventricle. The top row of panels shows the image with transmitted light and cmlc2::DsRed2-nuc fluorescence signals, and the lower row shows the same example but with the cmlc2::DsRed2-nuc signal alone. Note the severe oedema, weaker cmlc2::DsRed2-nuc fluorescence signal, reduced number of cells and smaller chamber size typical of the gata5 crispant (indicated by the yellow arrow in images); the oedema, and slightly enlarged ventricle observed in the api5 crispant; and the severe oedema, disorganisation of myocytes and smaller chamber size typical of the lmo2 crispants (yellow arrow). hspb7 crispant larval hearts outwardly appeared no different to the Cas9 controls. The scale bar shown in the upper left-hand image represents 50 μm.

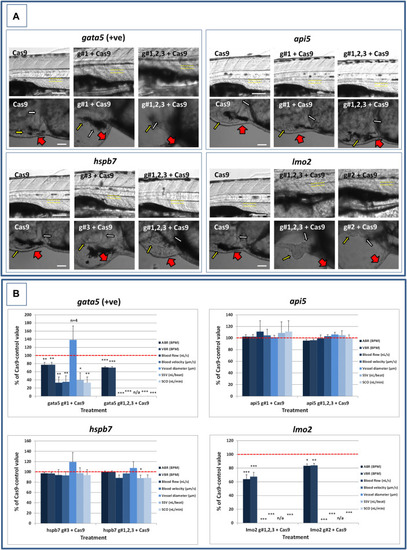
Results of the analysis of cardiovascular function in 4 dpf gata5 (positive control), api5, hspb7 and lmo2 zebrafish crispants versus the Cas9-injected control animals. (A): Images of example Cas9 control larvae alongside larvae treated with the two gRNAs + Cas9 mixtures giving the most robust phenotypes (as assessed at 2 dpf). Images are shown for gata5 crispants in the top left; for api5 in the top right; for hspb7 in the bottom left; and for lmo2 in the bottom right. In each case the top row shows the trunk vasculature with the position of the dorsal aorta outlined in yellow dashed lines, where blood flow and vessel diameter measurements were taken. The lower row of images shows the heart from the same animals, with the atrium highlighted by a small white arrow, and the ventricle by a small yellow arrow. The large red arrows show the position of the pericardial membrane and the extent of pericardial oedema. Most Cas9 control animals exhibited normal morphology and function in contrast with many of the crispants. (B): Cardiovascular functional endpoints quantified in the same groups of animals, with data shown for gata5 crispants in the top left; for api5 in the top right; for hspb7 in the bottom left; and for lmo2 in the bottom right. Note: the complete absence of blood flow measured in all of the gata5 g#1,2,3, and in 6/10 of the g#1-injected animals; and the absence of effective blood flow in the lmo2 g#1,2,3 and g#2-injected animals due to the absence of erythrocytes, meaning flow was not visible. Vessel diameter measurements were not possible in animals lacking blood flow (indicated by n/a). Data are shown as the mean % change versus the Cas9-control group (100% indicated by the red dashed line), ± SEM, n = 19–20 for the Cas9 and right-hand crispant treatment for each gene (data combined from two runs) and 10 for the left-hand treatment group for each gene where only one run was undertaken. *signifies a statistically significant difference versus the Cas9 control at p < 0.05, ** at p < 0.01, and *** at p < 0.001 (T-test or Mann Whitney U-tests for the combined guide injected groups, or 1-way ANOVA and Tukey’s HSD tests or Kruskal–Wallis and Dunn’s tests, for the single guide injected groups in which runs 1 and 2 were combined). The scale bar shown in the upper left-hand image of each panel represents 100 μm. The scale bar shown in the lower left-hand image of each panel represents 50 μm as a higher magnification camera mount was used in this case.

Acknowledgments
This image is the copyrighted work of the attributed author or publisher, and ZFIN has permission only to display this image to its users. Additional permissions should be obtained from the applicable author or publisher of the image. Full text @ Front Pharmacol