
- Title
-
Characterization of a novel zebrafish model of SPEG-related centronuclear myopathy
- Authors
- Espinosa, K.G., Geissah, S., Groom, L., Volpatti, J., Scott, I.C., Dirksen, R.T., Zhao, M., Dowling, J.J.
- Source
- Full text @ Dis. Model. Mech.

|
|
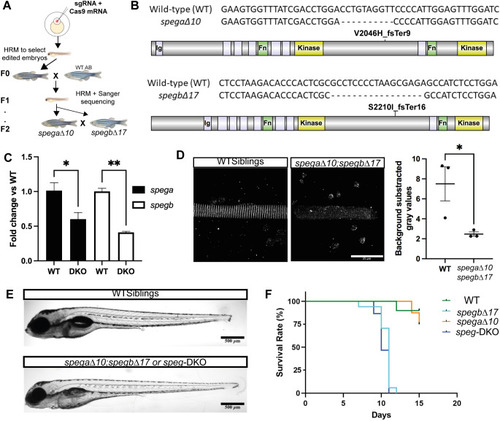
PHENOTYPE:
|

|
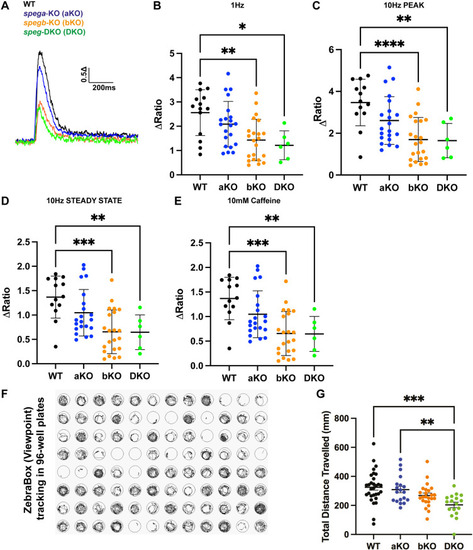
PHENOTYPE:
|
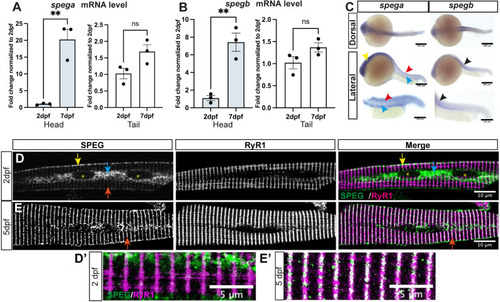
EXPRESSION / LABELING:
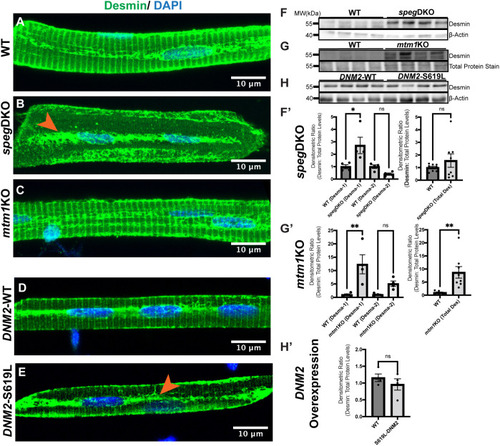
PHENOTYPE:
|

|