
- Title
-
The spliceosome factor sart3 regulates hematopoietic stem/progenitor cell development in zebrafish through the p53 pathway
- Authors
- Zhao, Y., Wu, M., Li, J., Meng, P., Chen, J., Huang, Z., Xu, J., Wen, Z., Zhang, W., Zhang, Y.
- Source
- Full text @ Cell Death Dis.
|

|

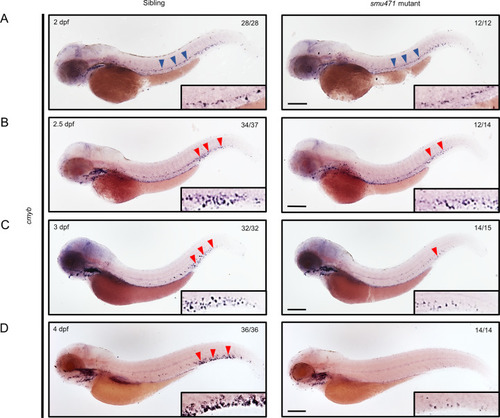
EXPRESSION / LABELING:
PHENOTYPE:
|
|
|
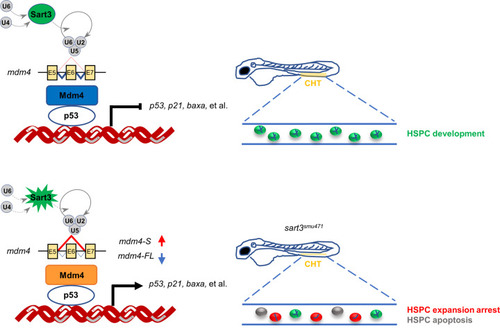
Schematic diagram of HSPC development regulated by Sart3-Mdm4-p53 pathway in zebrafish. Sart3, which could recycle U4 and U6 snRNPs into spliceosome assembly to affect pre-mRNA splicing [43], promotes HSPC development (current study). Mutation of Sart3 (highlighted in burst) reduces efficient recycling of U4 and U6 snRNPs (broken lines) so that normal splicing of mdm4 is disrupted. Mdm4 exon 6 (E6) skipping by sart3 mutation results in increased truncated mdm4 transcript (mdm4-S) and decreased mdm4 full-length transcript (mdm4-FL). The insufficiency of Mdm4 (orange rectangle) triggers activation of p53 pathway and promotes HSPCs to undergo proliferation arrest and apoptosis in zebrafish early hematopoiesis. |

ZFIN is incorporating published figure images and captions as part of an ongoing project. Figures from some publications have not yet been curated, or are not available for display because of copyright restrictions. |
|
ZFIN is incorporating published figure images and captions as part of an ongoing project. Figures from some publications have not yet been curated, or are not available for display because of copyright restrictions. EXPRESSION / LABELING:
PHENOTYPE:
|