
- Title
-
Integration of multiple imaging platforms to uncover cardiovascular defects in adult zebrafish
- Authors
- Bensimon-Brito, A., Boezio, G.L.M., Cardeira-da-Silva, J., Wietelmann, A., Ramkumar, S., Lundegaard, P.R., Helker, C.S.M., Ramadass, R., Piesker, J., Nauerth, A., Mueller, C., Stainier, D.Y.R.
- Source
- Full text @ Cardiovasc. Res.

alk5a –/– adult zebrafish display variable cardiac phenotypes without gross morphological defects. (A) Schematic of Alk5a WT and mutant proteins depicting each domain and the site of the mutation (star). (B, C) Brightfield images of 9 mpf WT (B) and alk5a–/– (C) zebrafish. (D, E) Brightfield images of alk5a–/– hearts (E) which occasionally exhibit a dilated outflow tract (OFT) lumen compared to WT (D). (F–I) Cryosections of WT (F, H) and alk5a–/– (G, I) hearts immunostained for Tg(kdrl: eGFP) expression (endothelial cells) and Elastin2 (F, G), and stained for haematoxylin-eosin (H, I) showing the expanded OFT lumen (Lu, dashed line) in alk5a–/– zebrafish. (J–L) Quantification of age (J), standard length (K), and body volume (L) of WT (n = 10) and alk5a–/– (n = 12) zebrafish used in the subsequent analyses. Plots show the values for each individual and the mean ± SD; P-values were determined by unpaired t-test (J, L) or Mann–Whitney test (K). The colour of each dot refers to the same zebrafish across all graphs. The dot adjacent to the number symbol (#) identifies the individual zebrafish mentioned in the text. Scale bars: 2 mm (B, C), 200 µm (D, E, H, I), 400 µm (F, G). A, atrium; EC, extracellular; GS, glycine–serine rich; SP, signal peptide; STK, serine–threonine kinase; TM, transmembrane; V, ventricle. |
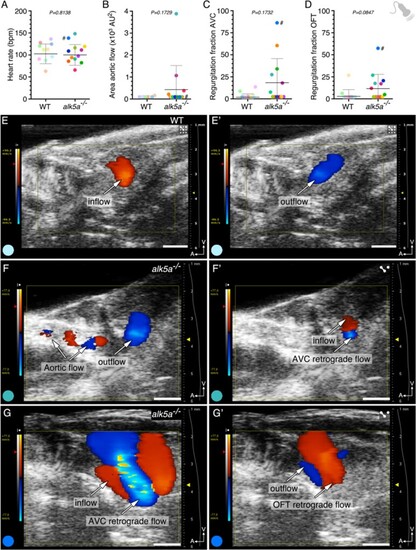
alk5a –/– adult zebrafish display variable haemodynamic defects. (A–D) Parameter quantification obtained with echocardiography analyses of WT (n = 10) and alk5a–/– (n = 12) adult zebrafish, including heart rate (A), area of the aortic flow (B), and regurgitation fraction in the AV (C) and OFT (D) canals. Plots show the values for each individual and the mean ± SD; P-values were determined by unpaired t-test (A) or Mann–Whitney test (B–D). (E, E’) WT zebrafish exhibit unidirectional blood inflow (red, E) and outflow (blue, E’) without signs of regurgitation. (F–G’) Examples of alk5a–/– zebrafish exhibiting a detectable aortic flow (F) and retrograde blood flow (F’–G’). The colour of each dot refers to the same zebrafish across all graphs and images. The dot adjacent to the number symbol (#) identifies the individual zebrafish mentioned in the text. Scale bars: 1 mm (E–G’). PHENOTYPE:
|
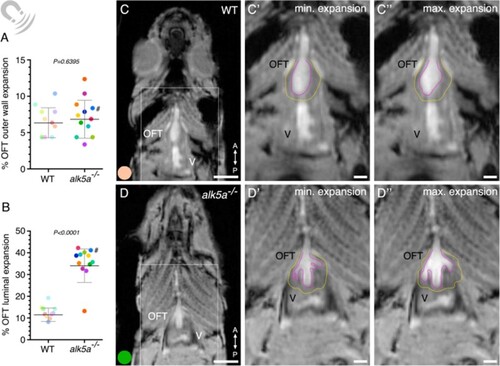
MRI analyses of beating hearts reveal increased OFT luminal dilation in alk5a–/– adult zebrafish. (A, B) Percentage of OFT outer wall (A) and luminal (B) expansion in WT (n = 10) and alk5a–/– (n = 12) adult zebrafish. Plots show the values for each individual and the mean ± SD; P-values were determined by unpaired t-test (A) or Mann–Whitney test (B). (C–D”) Single frames of MRI cines of WT (C–C”) and alk5a–/– (D–D”) zebrafish in coronal view. Boxed area is shown in C’, D’ (minimum expansion OFT) and C”, D” (maximum expansion OFT). Magenta dashed line, OFT lumen; yellow dashed line, OFT outer wall. The colour of each dot refers to the same zebrafish across all graphs and images. The dot adjacent to the number symbol (#) identifies the individual zebrafish mentioned in the text. OFT, outflow tract; V, ventricle. Scale bars: 1.5 mm (C, D), 500 µm (C’, C”, D’, D”). PHENOTYPE:
|
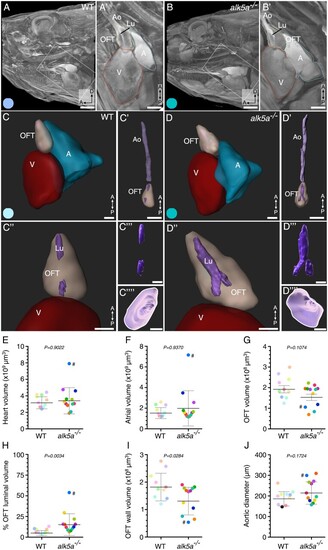
µ-CT analyses of cardiovascular morphology in alk5a–/– adult zebrafish reveal OFT defects. (A, B) µ-CT scans showing a sagittal plane of the anterior region of WT and alk5a–/– adult zebrafish. Boxed area is shown in A’ and B’. Dashed lines outline cardiac compartments. (C–D””) 3D reconstructions of the cardiac compartments in WT (C–C””) and alk5a–/– (D–D””) zebrafish, including the aorta (C’, D’) and OFT lumen (Lu; C’”, D’”). (C””, D””) 3D reconstructions of the aortic opening (white line) as seen from the OFT. (E–J) Quantification of morphological parameters for each cardiac compartment in WT (n = 10) and alk5a–/– (n = 12) zebrafish. Plots show the values for each individual and the mean ± SD; P-values were determined by unpaired t-test (G–J) or Mann–Whitney test (E, F). The colour of each dot refers to the same zebrafish across all graphs and images. The dot adjacent to the number symbol (#) identifies the individual zebrafish mentioned in the text. A, atrium; Ao, aorta; OFT, outflow tract; V, ventricle. Scale bars: 1 mm (A, B), 500 µm (A’, B’), 300 µm (C, D’), 400 µm (C”–D””). PHENOTYPE:
|

Correlation analysis of all the measured parameters reveals previously undetected cardiovascular phenotypes. (A, B) Correlograms of all the parameters analysed including biological features, as well as echocardiography, MRI and μ-CT analyses across all the WT (A; n = 10) and alk5a–/– (B; n = 12) zebrafish. Positive and negative correlations are shown in blue and red, respectively; dot size represents Pearson’s correlation coefficient. (C, D) Significant correlations (P < 0.05) in WT (C) and alk5a–/– (D) zebrafish. |

Combined imaging analyses facilitate the selection of specific phenotypes for high resolution morphological characterization. (A–C) Regurgitation fraction as obtained by echocardiography (A, B) and OFT luminal expansion as obtained by MRI (C) for two zebrafish (orange and purple, n = 2) plotted against the previously measured zebrafish (WT, black, n = 10; alk5a–/– grey, n = 12). Plots show the values for each individual and the mean ± SD; P-values were determined by Mann–Whitney test. Purple dot identifies the zebrafish selected for subsequent analysis with transmission electron microscopy (TEM). (D–E’) alk5a–/– zebrafish showing mild (orange, D, D’) and severe (purple, E, E’) regurgitation fraction in the AVC and OFT regions. (F, G) Semi-thin sections of WT and alk5a–/– OFTs stained with Richardson staining solution. Dashed line outlines the OFT lumen (Lu). (H–I”) TEM images of WT and alk5a–/– OFTs, showing the OFT lumen in blue, lined by ECs in green (H, I) and the OFT wall (H’, H”, I’, I”), including SMCs (red) and ECM (asterisk). Scale bars: 1 mm (D–E’), 200 µm (F, G), 5 µm (H), 10 µm (H’–I”). PHENOTYPE:
|

Sequential in vivo measurements allow the observation of phenotype progression. (A) Experimental setup for the sequential monthly measurements (t1, t2, t3) performed with echocardiography in WT and alk5a–/– in control conditions (n = 7 WT, n = 6 alk5a–/–) and upon treatment with isoprenaline (+ISO; n = 7 WT, n = 7 alk5a–/–). (B–F) Graphs showing changes in OFT (B) and AVC (C) regurgitation in WT and alk5a–/– adult zebrafish untreated or treated with isoprenaline. (G–I) Zebrafish # 2, which displays the most pronounced increase in the regurgitation fraction in the OFT from t1 to t3 (G), presented an enlarged OFT lumen in some histological sections (H) but not in others (I). Scale bars: 1 mm (D–G), 400 µm (H, I). PHENOTYPE:
|