
- Title
-
Functions of the Thyroid-Stimulating Hormone on Key Developmental Features Revealed in a Series of Zebrafish Dyshormonogenesis Models
- Authors
- Song, J., Lu, Y., Cheng, X., Shi, C., Lou, Q., Jin, X., He, J., Zhai, G., Yin, Z.
- Source
- Full text @ Cells

Generation of the tshba mutant zebrafish. (A) Schematic representation of the genomic structure of tshba and the targeting site on exon 3. The regions of the left and right arms are labeled above and below, respectively. The BtsCI site in the spacer is labeled above. (B) Genotyping of the tshba +/+, tshba +/−, and tshba −/− individuals represented with the un-cleaved and cleaved PCR products is indicated. (C) DNA sequences of the targeting regions of the tshba locus in wild-type and tshba mutant zebrafish. (D) Predicted putative wild-type and mutant Tshba protein structures. The 5 bp deletion generated a miscoded peptide after the 122th amino acid (AA) with the 23 miscoded AAs at the C-terminus. (E) Comparison results of quantitative RT-PCR analyses of the tshba and tshbb genes between the tshba mutant and its wild-type siblings at 5 dpf. (F) T4 immunofluorescence analyses at 5 dpf. The thyroid follicles are labeled in green for T4 with thyroxine immunofluorescence. Details of T4 immunofluorescent signals in the dotted white box are shown at high magnification. (G) Quantitative analyses of the T4 immunofluorescence signal at 5 dpf. Measurements were taken from wild-type zebrafish (n = 10) and tshba mutants (n = 9). (H) Quantitative RT-PCR analyses of TH synthesis-related genes, including the tg, slc5a5, and tpo gene in the tshba mutant and their wild-type siblings at 5 dpf. (I) Representative Western blotting of the TG protein from zebrafish at the 2 mpf stage using anti-TG antibodies. (J) Quantification of the relative expression of TG protein of the Western blot analyses. Measurements were taken from wild-type zebrafish (n = 5) and tshba mutants (n = 5). (K) Quantitative RT-PCR analyses of pituitary hormone genes, including cga, fshb, lhb, gh1, prl, pomca, smtla, and smtlb, in the tshba mutant and its wild-type sibling at 20 dpf. (L,M) Whole-body T4 levels (L) and T3 levels (M) in zebrafish at various stages. Measurements of THs were performed with three groups of wild-type zebrafish and three groups of tshba mutant zebrafish at 16, 20, 25, and 60 dpf stages. * p < 0.05; ** p < 0.01, ns: No significance. EXPRESSION / LABELING:
PHENOTYPE:
|
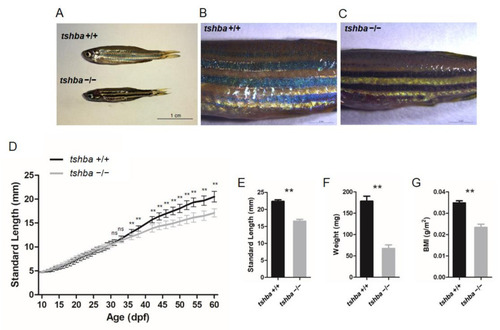
Somatic growth features of the tshba mutant fish and control wild-type siblings. (A) Wild-type control fish and tshba mutant zebrafish at 2 mpf. (B,C) Pigment pattern of wild-type control fish (B) and tshba mutant fish (C) at 2 mpf. (D) Curves of the somatic growth of wild-type control fish and tshba mutant fish. Means of standard length (SL) are presented as the growth curve. Measurements were performed with wild-type fish (n = 10) and tshba mutants (n = 10). Significantly distinguishable differences beginning at 36 dpf. (E–G) SL (E), whole-body weight (F), and body mass index (G) of tshba mutant fish and their wild-type siblings at 2 mpf. Measurements were taken of wild-type fish (n = 12) and tshba mutant fish (n = 10). ** p < 0.01. PHENOTYPE:
|

Comparative morphological analyses between wild-type fish and tshba mutant fish prior to the juvenile stage. (A) Comparative morphological features and their relationships with age of fish between tshba mutant zebrafish and their wild-type siblings. (B) Comparative morphological features observed and their relationships with fish size between tshba mutant zebrafish and wild-type siblings. The x-axes show developmental milestones describing early larval stages (left) toward late larval stages (right). Measurements were taken of wild-type fish (n = 11) and tshba mutants (n = 10). (C) Morphological features of wild-type and tshba mutants at 16 dpf. Arrows indicate the appearance of inflated anterior swim bladders. (D) Morphological features of wild-type and tshba mutants at 30 dpf. Arrows indicate the appearance of inflated aSBs. (E) Higher magnification views of wild-type fish (30 dpf) showing an inflated aSB (arrows), anterior squamation (SA; details in (e1), red arrowhead), minor fin fold (dotted yellow line, details in (e2) labelled with yellow asterisks), vent, and anal fin. (F) Higher magnification views of tshba mutant fish (30 dpf) showing a smaller inflated aSB (arrows), SA (details in (f1), red arrowhead), minor fin fold (dotted yellow line, details in (f2) labeled with yellow asterisks), vent, and anal fin. Stage abbreviations: CR, caudal fin ray appearance; AC, anal fin condensation; DC, dorsal fin condensation; MMA, metamorphic melanophore appearance; aSB, inflation of anterior swim bladder lobe; AR, anal fin ray appearance; DR, dorsal fin ray appearance; PB, pelvic fin bud appearance; PR, pelvic fin ray appearance; SP, posterior squamation; SA, anterior squamation.** p < 0.01. PHENOTYPE:
|

Larval-to-juvenile transition defects rescued by supplemental T3 treatments in PHENOTYPE:
|
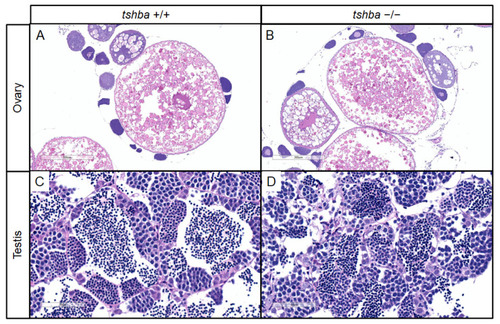
Changes in secondary sex characteristics in PHENOTYPE:
|

Changes in secondary sex characteristics in |
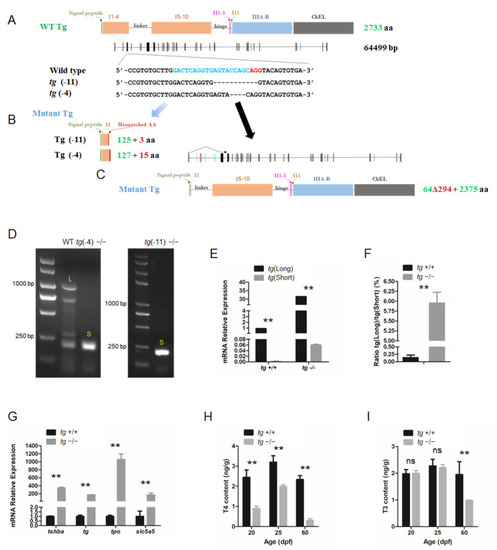
Generation of tg mutant zebrafish. (A) Schematic illustration representing the zebrafish Tg protein, the genomic structure of tg, and the CRISPR target site on exon 4. Sequencing of the tg CRISPR target site in wild type, tg (-4) mutant, and tg (-11) mutant zebrafish lines are shown in the lower panel. (B) The predicted truncated Tg proteins resulting from premature translational terminations are shown. (C) Proteins resulting from the alternative short transcript are shown. (D) The alternative short transcripts can be amplified in wild-type fish and tg mutants. The long transcripts were indicated by the letter L. The short transcripts were indicated by the letter S. (E) Quantification of the expression levels of the tg full-length transcript and short transcript in tg mutants and their wild-type siblings. (F) Ratio of the tg full-length transcript and short transcript expression in tg mutants and their wild-type siblings. (G) Quantitative RT-PCR analyses of tshba, tg, tpo, and slc5a5 expression levels in tg mutants and their wild-type siblings at 5 dpf. (H) Whole-body T4 contents of tg mutants and their wild-type siblings at the 20, 25, and 60 dpf stages. (I) Whole-body T3 contents of tg mutants and their wild-type siblings at the 20, 25, and 60 dpf stages.** p < 0.01, ns: No significance. EXPRESSION / LABELING:
PHENOTYPE:
|
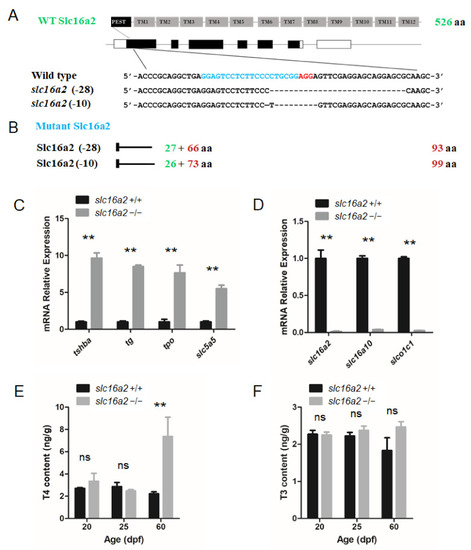
Generation of the EXPRESSION / LABELING:
PHENOTYPE:
|

Somatic growth in PHENOTYPE:
|
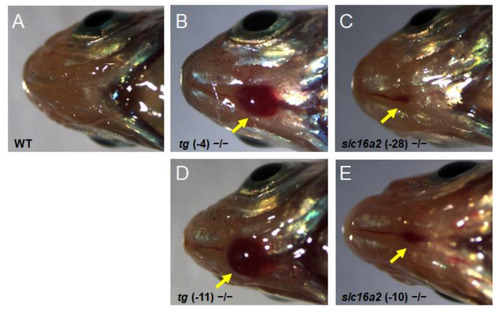
Goiter seen in PHENOTYPE:
|
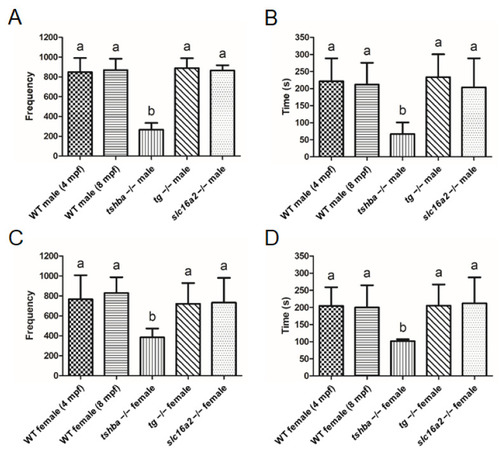
Reproductive behavior analyses in wild-type control fish and tshba, tg, and slc16a2 mutant zebrafish. (A,B) Mating behavior exhibited by wild-type female zebrafish towards the mutant male fish. Frequency (A) and duration (B) of intimate contacts are shown. (C,D) Mating behavior exhibited by wild-type male zebrafish toward the mutant female fish. Frequency (C) and duration (D) of intimate contacts are shown. Measurements were taken from wild-type control males (4 and 8 mpf) and females (4 and 8 mpf), tg mutant males (4 mpf) and females (4 mpf), slc16a2 mutant males (4 mpf) and females (4 mpf), and tshba mutant males (8 mpf) and females (8 mpf). n = 3 per group. a–b, different superscripts in the same column indicate significant differences (p < 0.05). PHENOTYPE:
|

Unillustrated author statements PHENOTYPE:
|